Linear Regression lines
The Linear Regression tool is just one of many tools that are available in the BullCharts charting software. The adjacent price chart shows a simplistic example of a regression line on a price chart of the All Ordinaries (XAO) index. In this Knowledgebase article, there is a little discussion about the tool, and one possible use for it as a part of a trading strategy.
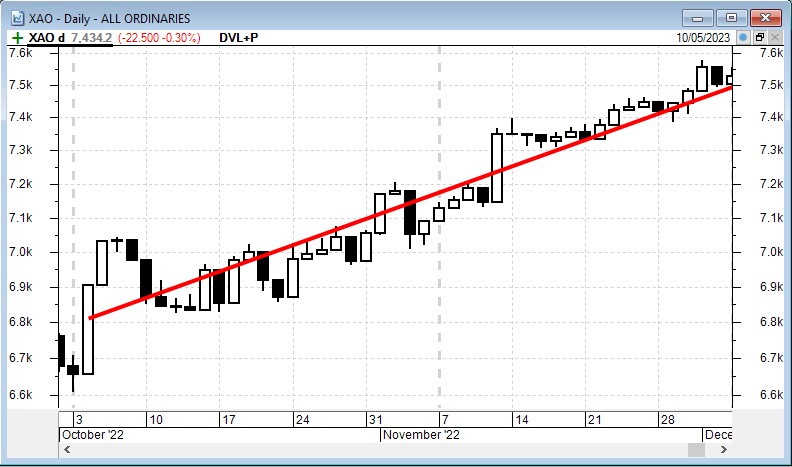
What is a Linear Regression line
In its simplest form a regression line is simply a straight line that is the “best fit” of several points on a graph. On a share market price chart, the regression line runs between a Start Date and an End Date, and is the line of best fit for the daily close share prices along that time frame. It can be used to indicate the share price trend over that time frame.
One way to use multiple regression lines
In the March 2023 User Group meeting, and the April user group webinar session, Des Bleakley described his exploration of using several regression lines. Following is a recording of the webinar presentation stored on YouTube.