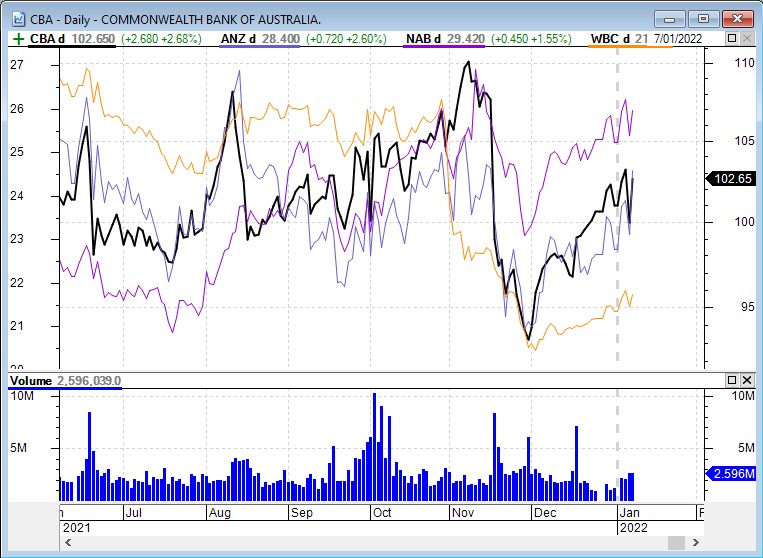
Another BullCharts KB article talks about how to “Insert Security”, using the menu option and/or the keyboard shortcut in order to add one or more securities to a price plot (see that KB article here). However, there are two other ways to insert another price plot into the current one as explained below. The resulting chart might be something like the sample shown below which shows the four big banks (CBA, ANZ, NAB, WBC).
(a) Drag and Drop
This is a faster way to add multiple securities to a price plot, using the drag-and-drop method to drag security symbols from a watchlist. The easiest way to explain this is video a short video demonstration. Please see the following 1 minute video from YouTube.
(b) Add Symbols to Chart
Another way to achieve the same result as described above is as follows.
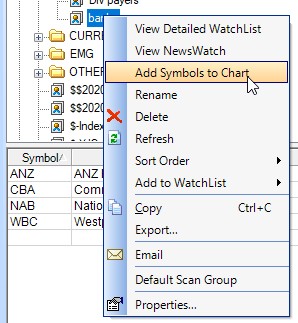
Let’s say you have a watchlist that contains a short list of securities. In the screenshot at right, I have a watchlist called “banks” (which is partly obscured) containing the four major banks (ANZ, CBA, NAB, WBC).
If I have a price chart on the screen, I can add a price plot for all of the securities in this watchlist to that current chart using the drop-down menu shown in this screenshot. Simply right-click on the watchlist name (in this case, the list called “banks”), then choose “Add symbols to Chart” from the drop-down menu.