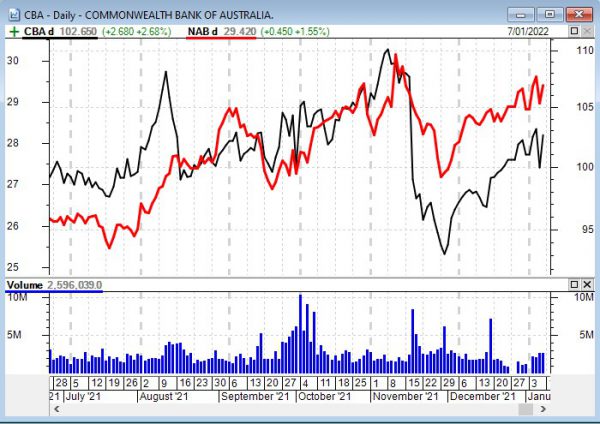
There are situations where you might want to “insert a security” to an existing price chart. That is, for example, you might have a price chart of a bank (eg. CBA) and you want to add in a price plot of one or more of its competitor banks. The resulting chart might look like the chart below.
[Note that the term security is used here because that is the terminology for any of: stocks, shares, ETFs, Managed Funds, commodities, etc. as used in the BullCharts system.]

To achieve this, with two or more securities shown on the one price plot, follow these steps:
- Create a price chart of your first security (in this case CBA).
[If you are new to BullCharts and you’re not sure how to do this,
use the menu option: File > New > Chart.] - Then either use the following menu item, or the keyboard shortcut:
Menu item: Insert > Security.
Keyboard shortcut: <Ctrl>+e (ie. hold down the Control key and tap the letter “e” on the keyboard – much quicker than using the menu). - In the dialogue box that appears, enter the “Symbol” for the security to be added (eg. NAB), and choose the “Period” from the drop down list. Now do NOT hit the OK button yet.
- Click on the Style tab and choose your “Plot Type” from the available options, and also the “Line Thickness”.
- Click on the “Location” tab, and select the desired location for your new price plot. To add this security to your original price plot, make sure to select the “Price…” plot from the list (just click on the entry once).
- Click on the “Colour” tab, and note the different colour methods available. Most people simply leave the “Colour Method” unchanged, and change the “Colour” in the bottom option to a strong and contrasting colour.
- Click on the “Scale” tab – now this is an important item. Carefully note the available options. If your two securities have very different prices, then you will not want to “Merge…”. Instead you will want to “Display new scale…”.
- Now you can click on the OK button.
Note that the “Insert Security” feature will simply put two (or more) plots for different securities on the one price chart. If you want to compare the relative performance of two (or more) securities, then you will need to use the Comparative Percent Performance feature (refer to the BullCharts KB article).
