BullCharts includes the Info Window panel to help read price and indicator values for any location across the price chart. An example use of this feature is shown in the example below. Two additional features will display various on-screen values – the Tooltip panel and the Tip Box – and these are also explained below.
Info Window panel
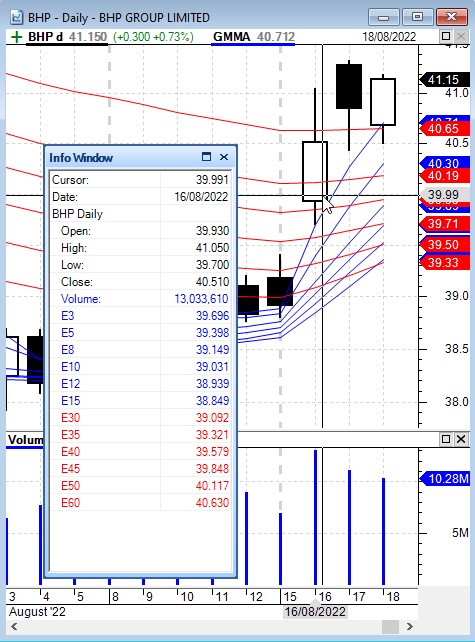
The Info Window panel displays all values for a particular date, including price values and the values of any indicator that is applied to the price chart. In the above example screen shot, note the following features:
- A daily candlestick price chart of BHP with the 12 Moving Averages of the GMMA indicator shown.
- The latest values for the daily candle and each of the 12 averages are shown as BullCharts price axis “tags” on the price axis.
- The BullCharts crosshair cursor is visible at a point on the chart for the date 16/08/2022 and a price level of $39.99.
- The Info Window panel sits in front of the price chart. It can be dragged around the screen to any other location (using the mouse click-and-drag operation).
- The Info Window panel lists the values for all price and indicator elements at the date position of the cursor, including: Open, High, Low, Close price values as well as Volume, and each of the 12 averages in the GMMA indicator.
How to Show/Hide the Info Window panel
There are a couple of ways to Show / Hide the Info Window panel as follows:
- Use the BullCharts menu option: View > Panels > Price Info Window. This will toggle between showing the panel and hiding the panel.
-
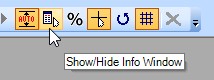
Info Window – Show/Hide toolbar button Use the toolbar button, normally located near the top right corner of your BullCharts window (see the screen shot at right). This will toggle between showing the panel and hiding the panel.
How to dock the Info Window panel
Note that if you mouse-click on the top border area of the Info Window panel and try to drag it around the screen, the small “locking” panels appear on the screen so that if you drag the Info Window onto one of these small panels, the Info Window will dock against the left side, or right side, of the screen window. Then, whenever you move the mouse cursor over the price chart, the relevant price values and indicator values will be displayed.
Another way to view price and indicator values
Don’t forget, there are two other ways to view price and indicator value as follows.
Tooltip panel
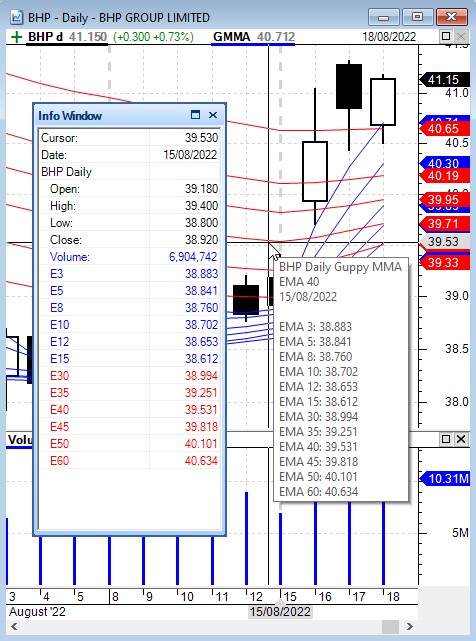
When you hover the mouse cursor over a particular chart element, relevant values will be displayed in a chart “tooltip” pop-up panel for that chart element. This is shown in the sample screen shot below, with the mouse cursor positioned on one of the 12 GMMA curves. The displayed tooltip panel indicates: the chart element (“BHP Daily Guppy MMA”); the very specific chart element (“EMA 40”); the date (15/08/2022); and the values of all indicators at that date. It doesn’t show any price values, unless the mouse cursor is hovered over the price element (candle, bar or line).
How to disable the Tooltip panel
As you move the mouse cursor around a price chart, the tooltip panel will pop up and display the relevant values at that point. On a chart that has many annotations, or text boxes containing a lot of text, the Tooltip panel can become annoying, or rather large, in which case you might want to NOT show the chart tooltips.
Alternatively, if your chart tooltips are not being displayed, it might be because the display of tooltips has been disabled.
To enable or disable the display of chart tooltips, use the menu option:
Tools > Preferences > “Show chart tooltips when moving mouse over it”.
Tip Box
Another way to view price values, and to hold this on the screen, is to use the Tip Box, as shown in the sample screen shot below. The Tip Box can be applied to any chart element. In this example there is one Tip Box attached to the candles (for 15/08/2022), and another one for the GMMA curve EMA3. To apply a Tip Box to the chart, simply right-click on the selected chart element (eg. a candle, or an indicator, etc.) and select Tip Box from the drop-down menu.
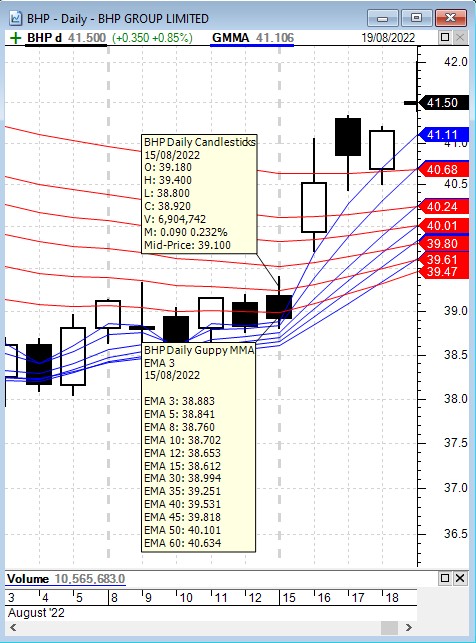
Note that the location of the Tip Box can be changed by dragging it around the window (click and drag any corner of the Tip Box), and the date it is reporting on can be changed by dragging it sideways across the chart (click and drag the inside of the box, or its anchor point on the chart element).
Also note that the Tip Box has various properties which can be customised. View the properties by right-clicking on the Tip Box, and select Tip Viewer Label Properties from the drop-down menu.