Introduction
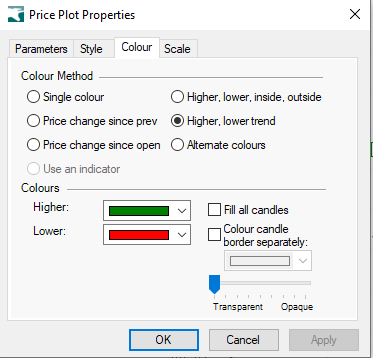
In BullCharts there are a few ways to colour the candles in a candlestick chart, as follows (refer to the screen shot at right):
- Single colour
- Price change since previous
- Price change since open
- Higher, lower, inside, outside
- Higher, lower trend
- Alternate colours
For more discussion on these options, refer to the separate KB article How to modify the properties….
In addition to these options there is another option that is greyed out in this screen shot – “Use an indicator”.
The “Use an indicator” option
This option is only available for a few indicators, and is enabled if the indicator script includes the parameter: “linestyle=PriceColor”. It allows an indicator to dynamically select the colour for the price plot. It works in a similar way as the ribbon. That is, specify several expressions, and the colour of the first one to evaluate to true gets used for the current bar. The JB Volatility Profit Taker indicator is a good example of the use of this feature. The only other standard indicator to use this is the Impulse indicator.
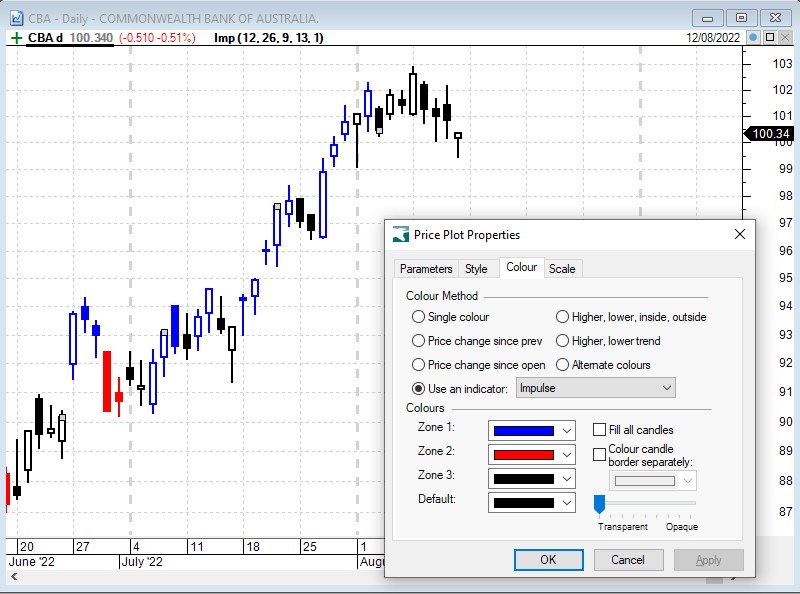
Example – Impulse indicator
The next screen shot (below) shows the Impulse indicator on a candle chart of CBA, as well as the price plot properties dialogue box showing the enabled option “Use an indicator”, and the four different “Zone” colours that are included in the indicator script (refer to that script in your indicator properties).
For more information about the PriceColor linestyle attribute, refer to the KB article “BullScript Attribute reference”. (That KB article is a very long one, so you might need to search the page for the text “pricecolor”).