The BullCharts software incorporates the concept of “Author Strategies”. These are trading ideas and strategies that have been developed by influential authors and active traders and are included within BullCharts to provide an excellent choice of tools to make it easier for BullCharts users to learn and implement them. These are rarely included as comprehensively in other software packages.
The information below will help you to become familiar with the available author strategies, and to search through them to find a strategy that might suit you, so that you can develop or fine tune your own strategies. There is also some information to help you better manage your own growing collection of custom scans and indicators.
The Author Strategies that are included in BullCharts are the ideas of well known and well regarded personalities including:
- Alan Hull
- Chande & Kroll
- Colin Nicholson
- Dr Alexander Elder
- Daryl Guppy
- Jim Berg
- Joe DiNapoli
- John Bollinger
- Leon Wilson
- Louise Bedford
- Martin J Pring
- Nicolas Darvas
- Robert C Miner
- Robert Deel
- Robert Fischer
- Stan Weinstein
- Welles Wilder
Case study – Stan Weinstein
To better explain and demonstrate these Author Strategies, let’s work through a case study example using one of these well known authors. Book reference: “Secrets for Profiting in Bull and Bear Markets”; Weinstein, Stan, 1988. This book is regarded by many people as a “must read” for newbies to trading.
Stan Weinstein’s key ideas
In his one and only book, Stan suggests using weekly price charts, and the 30 week Moving Average. He also talks at length about Stage Analysis which is described as follows.
Stage Analysis
The diagram below helps to explain the notion of Stage Analysis. It represents a simple weekly share price line chart with the 30 week Moving Average. Weinstein says in his book (pp31-41) that at any point in time, any stock has to be in one of four market stages:
- Stage 1 = the Basing area;
- Stage 2 = the Advancing stage;
- Stage 3 = the Top area;
- Stage 4 = the Declining stage.
He also says that these four stages do not necessarily always follow each other in the sequence indicated here. For example, it’s possible that Stage 3 can be followed by another Stage 2. For more information about this topic, the reader is encouraged to pursue Stan’s book.
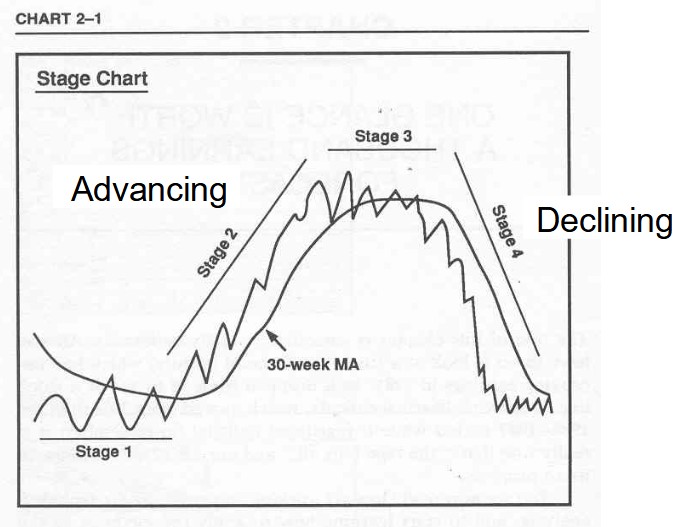
(Source: “Secrets for Profiting in Bull and Bear Markets”;p32)
How would it be if we could find the stocks that are moving from Stage 1 into Stage 2, and which are about to rally in the so-called advancing stage? BullCharts includes five market scans based on Weinstein’s ideas, and one in particular searches for stocks “Entering Stage 2 from 1”. By running this scan across a specific watchlist, you might be able to produce a list of stocks whose share prices are behaving in this manner.
In BullCharts, this scan can be found by viewing the list of scans in the BullScan Manager by “Author”, as shown in the adjacent screen shot. To do this:
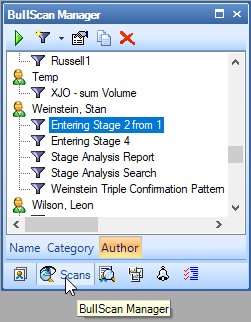
- Use the menu options: View > Panels > BullScan Manager.
- Alternatively, open the Security Manager; and
- Click on the “BullScan Manager” tab at the very bottom of the BullScan Manager panel.
- With the three tabs across the bottom of the BullScan Manager (the second bottom row of tabs, as in the adjacent screen shot), click on the “Author” tab; and
- Scroll down the list of scans until you locate “Weinstein, Stan” toward the bottom of the list.
- The scans attributed to Stan Weinstein are listed there.
Test this approach
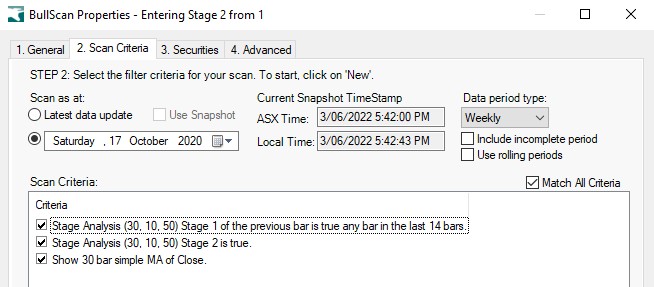
To test this particular approach, you could run this scan across all securities; and to guarantee you get some reasonable results, try the following tweaks:
- Change the first Scan Criteria to search for: “Stage 1 of the previous bar is true for any bar in the last 14 bars” (or any other number of bars of your choosing).
- Change the “Scan as at:” date from “Latest data update” to: “Saturday, 17 October 2020”. This is a period in time that is far enough past the COVID bear market of early 2020, to a time when many stocks had started to rally from their post-COVID lows. And as this date is several months in the past, you will be able to see the share price performance since that date.
- When you are ready to run the scan, click on the “Apply and Run” button.
Once your scan has finished, there should be at least a few stocks in your Scan Results Table. Double click on one of these stocks. This will cause BullCharts to open a new weekly price chart using your Default Template, and it will add a few items to the chart:
- A fine, vertical, red, dotted line at the Scan Date.
- The 30 week Moving Average.
- The Stage Analysis indicator ribbon across the bottom of the chart.
Many strategy ideas are implemented in the chart indicators in BullCharts. It is easy enough to look at a short list of the indicators attributed to one author, and then insert one of those to your price chart.
You can find these as follows:
- Use the menu option: Insert > Indicator, (or use <Ctrl>+i ) to display the relevant dialogue box.
- Under the “Insert” tab (as shown in the adjacent screen shot), click in the “Category” drop-down selection and scroll all the way down the list, noting the many options that are there. The last, long bunch of entries are the authors, and the sample shown here includes several custom entries that are not included in the standard BullCharts. These can be added by the user.
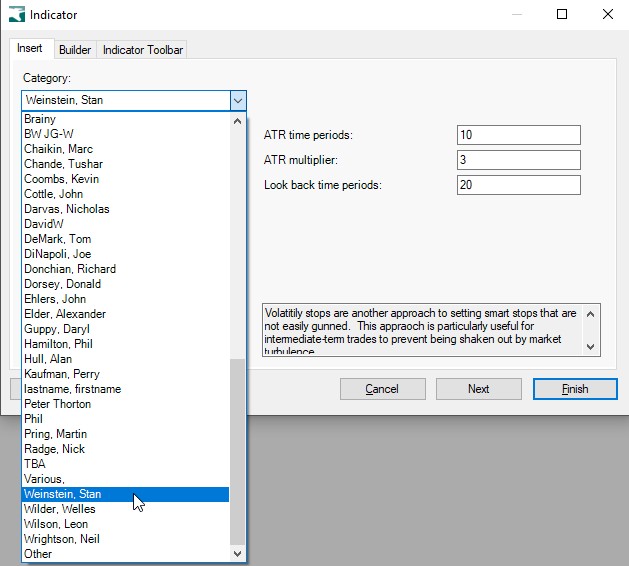
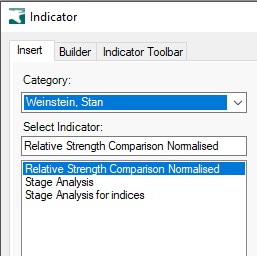
- Scroll down the list to “Weinstein, Stan”, for example, and click on that entry. You will then see just the indicators that are attributed to Stan Weinstein, as shown in the next adjacent screen shot (noting that the indicator “Stage Analysis for indices” is a custom indicator and not included with BullCharts).
- You can now select an indicator from this list.
Note that there might be some indicators where this does not work because the indicator script does not include enough of the keyword attributes.
How can you easily find your own scans and indicators?
As you develop your own scans and indicators, you might want to be able to manage them in a clever way so that you can find them more easily going forward. This can be done as follows.
How to categorise your scans
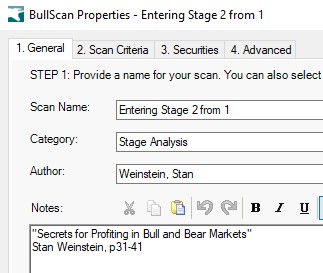
In the sample Weinstein scan we studied above, if you take a look at the Scan Properties, and click on the first tab labelled “1. General” (as in the screen shot at right), note that there are three fields containing information which the user can change, or where you can enter your own details for your own scans. These fields are: Scan Name, Category, and Author. Note there is also a large area for “Notes” where you can type in anything you like to help explain the scan, or the objective, or the background, etc., and this information can be formatted.
Note that these three fields are the same as the available viewing options in the BullScan Manager. When you type information into these fields, you can type anything as the “Scan Name”. You can type anything into the “Category” and the “Author” fields. If the category or author don’t exist, then they will be created. If your entry exactly matches an existing entry then the scan will be added to the list. However, if your entry does not exactly match an existing entry (perhaps using lower case instead of upper case, or missing a space character), then a new item will be created – so take care.
How to categorise your indicators
If you go through the steps to insert the Stage Analysis ribbon indicator to your chart, but before you click on the final “Next” or “Finish” buttons, if you click on the “Builder” tab toward the top of the dialogue box, and then click on the “Edit…” button and scroll the window down a little, you will see the Script Helper as shown in the screen shot below.
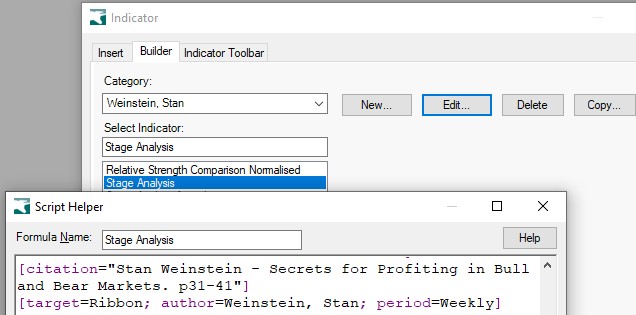
In this screen shot, note the following coloured text in the script:
- “[target=Ribbon; ” – This script statement firstly sets this indicator to be a “ribbon” indicator so BullCharts knows to insert it on the chart as a ribbon. This causes the indicator to be listed in the group of ribbons which you can see when you use the “Insert > Indicator” dialogue.
- “[target=Ribbon; author=Weinstein, Stan;” – The next bit of text in the script statement defines the “author” as “Weinstein, Stan”. It is this text that adds this indicator to any other indicators for which Stan Weinstein is attributed as the author.
Having explained how this grouping works, perhaps you can understand that to add your own indicator to yourself as the “author”, you only need to use the Indicator Builder and edit the indicator and add the attribute: author=….; to your indicator script.
Summary
In this KB article we have looked at some of the detail behind the Author Strategies and how to find them, and how to set up your own scans and indicators to help you manage them and find them, with some attributed to yourself as the author.