Attribute Reference
The following pages list the attributes that are built into BullScript. Attributes are used to provide additional information about how your BullScript should be applied.
Attributes
Using Attributes
BullScript allow you to specify the way you want the results of a script to be displayed within the script itself, using its attributes system.
Attributes are defined within square brackets, “[” and “]”, and appear before the plots that they relate to. They consist of the name of the attribute being used, followed by an “=”, followed by the value of the attribute.
For instance, if you wanted to plot a 28-day simple moving average and a 14- day simple moving average, but you wanted the 28-day moving average to be displayed in green, and the 14-day moving average to be displayed in red, you could use the following code:
[color=green]

ma(C,28,SIMPLE);

[color=red]

ma(C,14,SIMPLE);
If a plot has more than one attribute, the attributes may be seperated by semicolons, or placed in separate sets of square brackets. For example, if you wanted to plot a 14-day moving average in red, on a new pane, you could use,
[color=red;

target=price]

ma(C,14,SIMPLE);
or
[color=red]

[target=price]

ma(C,14,SIMPLE);
Some attributes, such as author and category may take multiple values. All values must be given in the same attribute, and must be separated by pipes. See the table below for details.
[category=Moving Average|Verticality]

ma(C,14,SIMPLE);
Available Attributes
| Attribute | Possible Values | Description | Examples |
|---|---|---|---|
Alias |
Any text | An alternative name by which the formula may be called within BullScript. This will often be an abbreviation. | [alias=MyRSI] |
Author |
Any text (for example Hull, Alan) | The author of the indicator. By convention, use the last name then the first name. Multiple authors may be listed, separated by pipes. | [category=Hull, Alan] |
Category |
Any text (for example Volume) | The category that the formula is in. Multiple categories may be listed, separated by pipes. | [category=Moving Average] |
Citation |
Any text | A reference to documentation on which the formula is based. | [citation="Trading Systems, Wilder"] |
Color |
Colour names or RGB values given as rgb(red,green,blue) | The default colour of the plot. | [color=red] |
Description |
Any text | A description of the formula. This will appear on the Insert Indicator page. | [description="The moving average can be used to smooth noisy |
FillStyle</code |
Name of pattern to use. See list. | Background pattern for ribbons. | [fillstyle=Weave] |
Font |
Default, or any font name, eg: Verdana, Arial, Wingdings | The font face, or family, used for markers and text plots. | [font="Courier New"] |
FontSize |
Default, or a positive number. | The size of the font in points for markers and text plots. | [fontsize=12] |
FontStyle |
Default, or any of Bold, Underline, Italic or Strikeout separated by commas. | The style of the font for markers and text plots. | [fontstyle=Bold,Underline] |
HorzLine |
List of numbers separated by commas. | Levels at which horizontal lines should be displayed. | [horzline=20,80] |
LineStyle |
Solid, Dotted, Dash, Long Dash, Step, Dotted Step, Horz Step, Bar, Grounded Bar, Points, Marker, Fill, NoPlot, Text. | The style with which the plot will be drawn. | [linestyle=step] |
LinkedChart |
SelectionOnly | If an indicator has this attribute and it is included in a scan, then when a linked chart is created, only selected plots are shown on the chart. | [linkedchart=selectiononly] |
Name |
Any text | The name for an individual plot. | [name=Signal Line] |
Password |
Text | The password must be entered to view or edit the indicator script again – but not to use the indicator. | [password=12345] |
Period |
Daily, Weekly, Monthly, Quarterly, Yearly | The timeframe that this indicator intended for use on. Do not specify if the indicator can be used on any timeframe. | [period=Weekly] |
SortPlots |
ByName | Normally an indicators plots are shown in the properties window in the order they are scripted. This attribute causes them to be sorted by name. | [sortplots=byname] |
Target |
Price, Volume, New Pane, New Axis, Overlay, Percent, Default | The pane and scale that the plot will use by default. | [target=price] |
TextAlign |
Center, Above, Below, Left, Right | Specifies where text is placed relative to a data point. | [TextAlign=Above, Left] |
TextFormat |
Default, other format string | Allows advanced formatting options for displaying dates and numbers as text. | [TextFormat=00 00 00 |
Transparency |
Number between 0 and 100 | Specifies the transparency for a filled linestyle. 0 for completely opaque and 100 for completely transparent. | [transparency=95] |
Visible |
Yes, No | Whether or not the plot is visible by default. | [visible=no] |
Width |
Positive number | The width of the plot line. | [width=2] |
Color Attribute
Usage
[color=named-color]
[color=rgb(red,green,blue)]
- named-color
- See the list below.
- red
- The red component of a colour. An integer between 0 and 255 inclusive.
- green
- The red component of a colour. An integer between 0 and 255 inclusive.
- blue
- The red component of a colour. An integer between 0 and 255 inclusive.
Description
Specifies the colour for the following plot or ribbon component. You can either specify one of the named-colours listed below, or you can specify a colour exactly using the RGB notation.
Colour names are case insensitive and space insensitive. That is, you can remove the spaces from colour names and they will work as expected.
Note the American spelling of the color attribute. In general, BullScript uses American spelling for keywords as this is standard in most computer languages.
Example
[color=Red]
[color=AliceBlue]
[color=aliceblue]
[color=”Alice Blue”]
[color=rgb(0,128,255)]
Named Colors
| Alice Blue
Antique White Aqua Aquamarine Azure Beige Bisque Black Blanched Almond Blue Blue Violet Brown Burly Wood Cadet Blue Chartreuse Chocolate Coral Cornsilk Crimson Cyan Dark Blue Dark Cyan Dark Goldenrod Dark Gray Dark Green Dark Khaki Dark Magenta Dark Olive Green Dark Orange Dark Orchid Dark Red Dark Salmon Dark Sea Green Dark Slate Blue Dark Slate Gray |
Dark Turquoise
Dark Violet Deep Pink Deep Sky Blue Dim Gray Dodger Blue Firebrick Floral White Forest Green Fuchsia Gainsboro Ghost White Gold Goldenrod Gray Green Green Yellow Honeydew Hot Pink Indian Red Indigo Ivory Khaki Lavender LavenderBlush Lawn Green Lemon Chiffon Light Blue Light Coral Light Cyan Light Goldenrod Yellow Light Gray Light Green Light Pink Light Salmon |
| Light Sea Green
Light Sky Blue Light Slate Gray Light Steel Blue Light Yellow Lime Lime Green Linen Magenta Maroon Medium Aquamarine Medium Blue Medium Orchid Medium Purple Medium Sea Green Medium Slate Blue Medium Spring Green Medium Turquoise Medium Violet Red Midnight Blue Mint Cream Misty Rose Moccasin Navajo White Navy Old Lace Olive Olive Drab Orange Orange Red Orchid Pale Goldenrod Pale Green Pale Turquoise Pale Violet Red |
Papaya WhipPeach Puff
Peru Pink Plum Powder Blue Purple Red Rosy Brown Royal Blue Saddle Brown Salmon Sandy Brown Sea Green Sea Shell Sienna Silver Sky Blue Slate Blue Slate Gray Snow Spring Green Steel Blue Tan Teal Thistle Tomato Turquoise Violet Wheat White White Smoke Yellow Yellow Green |
See Also
FillStyle Attribute
Usage
[fillstyle=style-name]
- style-name
- See the list below.
Description
Specifies the fill style to be used on the ribbon backgound.
Example
[fillstyle=SmallConfetti]
Fill Style Names
|
|
See Also
LineStyle Attribute
Usage
[linestyle=style-name]
- style-name
- See the list below.
Description
The linestyle attribute describes how the following calculations will be display. Most of the possible line styles change the formatting of a normal plot line.
There are several special formats available, some of which apply to results in pairs. See below for a detailed example of using various linestyles.
Normal LineStyle values
| Value | Description | Examples |
|---|---|---|
Solid, Dotted, Dash, Long Dash |
Draws diagonal lines in the style described from points to point. | [linestyle=Solid] |
Step, Dotted Step, Horz |
Draws stepped lines in the style described from point to point. A horizontal line is drawn right from the previous point to the location of the next point, then a vertical line is drawn to the second point. | [linestyle=Step] |
Bar |
Vertical bars are drawn from zero to the current point. Suitable for bar charts that may go negative. | [linestyle=Bar] |
Grounded Bar |
Vertical bars are drawn from the bottom of the chart pane to the current point. Suitable for bar charts that will always be positive, such as volume. | [linestyle=Grounded Bar] |
Points |
Dots are drawn at each value. | [linestyle=Points] |
Special LineStyle values
| Value | Description | Inputs | Examples |
|---|---|---|---|
Marker |
The expression is interpreted as true/false. If ‘true’ is returned then a signal marker is drawn. Used in conjunction with the marker attribute, which specifies which marker to draw. Markers can also be used as a scan criteria in BullScan. Note: The show markers indicator option must be checked for markers to appear on a chart. | 1 | [linestyle=marker] |
VerticalMarker |
Behaves the same as marker, except a vertical line that extends through the chart gets shown instead of an icon. | 1 | [linestyle=verticalmarker] |
NoPlot |
This result never gets drawn on a chart. This is useful for making a calculation available to BullScan without having them appear on a chart. See also: visible attribute. | 1 | [linestyle=hidden] |
Text |
Expressions are accepted in pairs. The first expression determines the text to show, and the second determines where it is shown (in terms of the y-axis). If either expression returns undefined then no text is shown. Various attributes are available for formatting text. | 2 | [linestyle=text] |
Fill, Fill Step |
Expressions are accepted in pairs, and the gap between the two expressions is filled. With fill, the two expressions describe an area using normal (diagonal) lines, whereas Fill Step describes an area using stepped lines. The colour attribute can be used ahead of each of the two expressions, and the colour of the expression on top is used as the fill colour. | 2 | [linestyle=fill] |
Fill Bars |
Expressions are accepted in pairs. Vertical bars are drawn between the two expression points. The same colouring rules apply as for Fill. Fill Bars can be used in conjunction with Fill Step and Horz Step to construct boxes such as the Darvas boxes. | 2 | [linestyle=fill bars] |
Candle |
Four expressions should follow this attribute. They will be evaluated and treated as the open, high, low and close values of a candlestick respectively. Note that this will not effect the price values as seen by other scripts, or pattern tools – it is simply a method of formatting the four expressions. If an indicator has target=Price and a candle plot then it will prompt you to hide the real price plot. | 4 | [linestyle=candle] |
Signal |
Equivalent to [linestyle=marker]. |
1 | [linestyle=signal] |
PriceColor |
Allows an indicator to dynamically select the colour for the price plot. Works in a similar way as the ribbon. Ie, specify several expressions, and the colour of the first one to evaluate to true gets used for the current bar. See the JB Volatility Profit Taker indicator for an example of this feature. | many | [linestyle=pricecolor] |
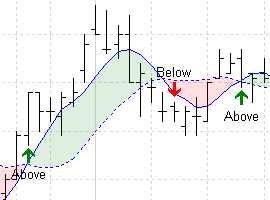
Example 1 – Fills and Markers
This chart can be created using the script shown below. It is a modified version of the built-in “Moving Average – Crossover” indicator. The script demonstrates the Dash, Fill and Marker line styles.
[target=Price] [name=Short MA]
shortMA := ma(Close,5,simple);
shortMA;
[name=Long MA; linestyle=Dash]
longMA := ma(Close,13,simple);
longMA;
{ Fill } { Note that fill is green when shortMA is above longMA. } [linestyle=Fill] [color=shortMA] res1;
[color=longMA] res2;
{ Markers } { The name attribute automatically gets shown as a label. } { Use ‘tooltip’ to display a message when you hover over the marker. } [name=Above; linestyle=marker; marker=Long] [tooltip=”Short MA passed above Long MA”] cross(shortMA,longMA);
[name=Below; linestyle=marker; marker=Short] [tooltip=“Short MA passed below Long MA”] cross(longMA,shortMA);
Example 2 – Generating Text
Text can be generated and placed on the chart. The script below generates text for peaks and troughs of the zigzag function. Note that each text element is followed by two expressions. The first one determines the text to be shown, or undefined if no text is to be shown, and the second one indicates at what price level the text should be drawn. Combining the price level with the textalign attribute, the ‘peak’ label is drawn Above the High price.
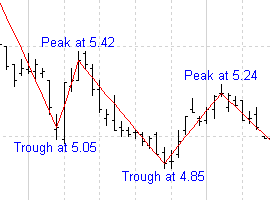
[target=Price]
size := input(“Zig zag size“,4,0);
z := zigzag(Close,size,%);
ispeak := z>hist(z,1) and z>future(z,1);
istrough := z<hist(z,1) and z<future(z,1);
[linestyle=Solid; color=Red]
z;
[color=Blue] [linestyle=Text; textalign=Above,Center] if (isPeak, “Peak at ” + z, undefined);
High;
[linestyle=Text; textalign=Below,Center] if (isTrough, “Trough at ” + z, undefined);
Low;
See Also
Ribbons
Usage
[target=Ribbon]
- results
- One true/false result for each ribbon mode.
Description
A ribbon is displayed as a thick coloured bar at the bottom of the chart. The ribbon show different colours, or modes, to represent the current condition of the stock being analyzed.
To create a ribbon, first use the [target=Ribbon] attribute. Then define several calculations that evaluate to true or false, similar to the way markers work. Each result is evaluated in turn from top to bottom. The first calculation that is true is selected as the ribbon mode for the current bar.
Typically a name, colour and fillstyle attribute is given for each ribbon mode, and is defined before the calculation they relate to. A final colour can also be specified at the end of the indicator. This will be used if no conditions are matched.
Example
In this example, a green bar labelled ‘Rising’ will be shown when the 12 day moving average is above the 26 day moving average. A red bar labelled ‘Falling’ will be shown when the 12 day moving average is below the 26 day moving average.
[target=Ribbon]
[color=LightGreen; name=Rising]
[fillstyle=small grid]
MA(C,12,S)>MA(C,26,S);
[color=Pink; name=Falling]
[fillstyle=diagonal cross]
MA(C,12,S)<MA(C,26,S);
[color=White]
Results:
![]()
See Also
Target Attribute
Usage
[target=target-type]
- target-type
- See the list below.
Description
Specifies the pane and/or axis that the indicator should appear on by default. Note that this can be overridden when the indicator is inserted.
BullCharts also has an option in the preferences to control how any indicator marked as target=default should be treated. It is recommended that newaxis, newpane and overlay not be used in light of this preference.
Presently only one target can be applied per script, however this may be revised in future versions of BullCharts.
Example
[target=Price]
ma(C,10,S) * 1.1;
ma(C,10,S) * 0.9;
Accepted Target Types
| Name | Description |
|---|---|
default |
No special treatment should be applied to this indicator. By default a new pane will be created, however this can be changed in the application preferences. Using target=default is equivalent to if no target is specified. |
newaxis |
The indicator is added to the current (last clicked) pane and a new axis is created on the left hand side, replacing any axis that was previously there. |
newpane |
The indicator will be placed in a new pane, regardless of the whether the application preferences say that indicators should be placed. It is generally better to use default. |
overlay |
The indicator is added to the current (last clicked) pane. An axis is only shown if either side doesn’t have one already. |
percent |
Indicates that the results generated are of a percentage nature. Presently this is treated the same as default. |
price |
Indicator should appear on the same pane and axis as the selected price plot. This is recommended for indicators that function similar to moving averages. The results should be in roughly the same range as those for the price chart or scaling problems may result. |
ribbon |
The indicator should be displayed as a ribbon (a thick coloured bar at the bottom of the chart). One true/false result should be returned for each ribbon mode. See the Ribbon help topic for more details. |
volume |
Indicator should appear on the same pane and axis as the volume plot. If the volume pane is not currently visible then it will be shown. The indicator should give results roughly in the same range as the volume data. |
See Also
Attributes | LineStyle | Ribbons
TextFormat Attribute
Usage
[textformat=format-string]
- format-string
- See notes below.
Description
The textformat attribute is similar to the dp attribute in that it controls how data is formatted as text. However, it is much more flexible than the dp attribute. The textformat takes a .Net format string and can be used to apply a variety of formats to either numbers or dates.
If [textformat=default] is used the textformat will be switched off. The textformat attributes overrides the dp attribute. Therefore if textformat has been used in a script, then [textformat=default] should be used later if you want to start using the dp attribute again.
The textformat attribute currently only affects the formatting of BullScan column results.
This feature is recommended only for use by people who have prior programming experience.
Examples
[textformat=00 00 00 00] will make the number 12345678 appear as 12 34 56 78
[textformat=E] will make numbers appear in scientific (exponential) notation
[textformat=##;(##)] will show negative numbers in brackets
Format Strings
Documentation of the allowable format strings are beyond the scope of this manual. However, information is available from the Microsoft .Net online help. Click on the following links for details about format strings:
- Description and examples of basic numeric formats
- Description and examples of advanced numeric formats
- Description and examples of basic date formats
- Description and examples of advanced date formats
See Also