About the BullCharts Fundamental Report
There are several fundamental data items available within the standard BullCharts database. The screenshot below shows a price chart of CBA with the Dividend Vertical Lines indicator (the vertical dotted lines), and the “CBA Daily Fundamental Report”, showing the 20 or so fundamental data items that are stored and available.
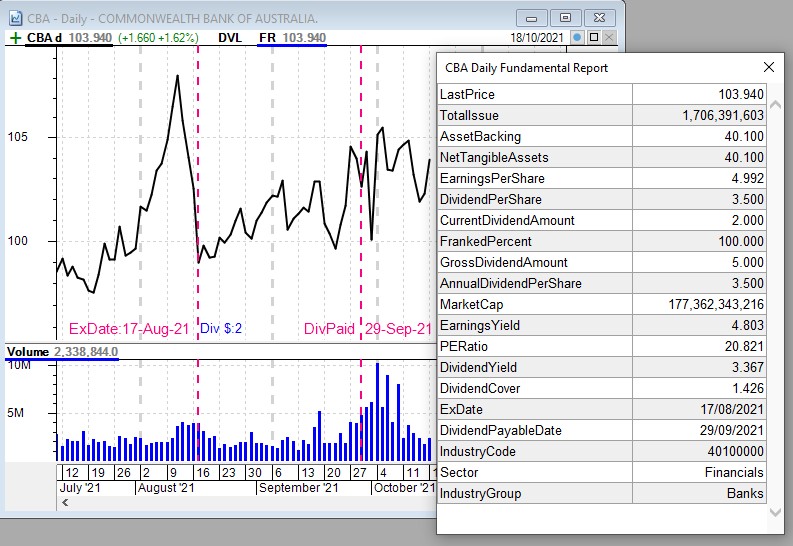
In the above screenshot example, the header in the Fundamental Report window pane actually says: “CBA Daily Fundamental Report” because it accompanies a daily price chart of the stock. Remember that most of these fundamental metrics change once every six months or so – when the company announces the latest fundamental data, usually with their half-yearly reporting. In between these 6-monthly reporting dates there are usually no changes to most of these metrics (except, of course, the market cap and PE Ratio which change daily along with the share price).
Once this window panel is inserted to the price chart, it will sit in front of the chart, and is essentially “floating” in front of the BullCharts window. It can even be dragged across to another monitor.
How to reduce this long list of fundamentals
If you would like to view this fundamentals panel, or at least a portion of it, then you can customise this list so as to display only selected items. This will take up less space on the screen, and obstruct less of the price chart. To do this, simply copy the indicator, and edit the BullScript and remove the items that you don’t want. This might sound a little complex, but is fairly straight forward using the BullCharts Indicator Builder to Edit the copy of the indicator.
Author: Robert Brain (aka Brainy)
Australian BullCharts User Group convenor