BullCharts 4.4
This is an upgrade that requires BullCharts to be already installed.
F5 Manually be able to refresh all open charts after a download
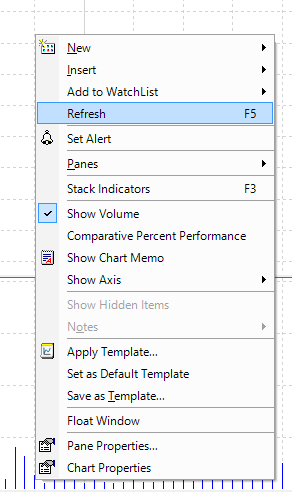
If you have an open chart, the chart will not update with the latest intraday or end of day data until the chart is reopened. Now it is possible to refresh all open charts by press F5 or from the context menu select Refresh.
Identify charts that are using Metastock data
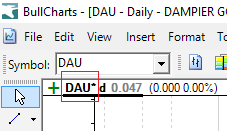
If you using BullSystems as your database, and used Open Metastock display a chart, the chart window will identify the source with *.
Time period is abbreviated
To economise on space in the chart header, the time period is abbreviated.
1 Minute : 1min
1 Hour : 1h
Daily : d
Weekly : w
Monthly : m
Quarterly : q
Yearly : y
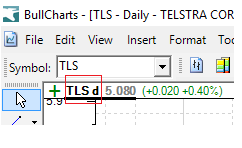
Previously the Chart Header displayed Open High Low Close as well. If a number of charts were opened, then the tags would be hidden. By condensing the information, it is possible to view more chart tags. The data was moved to a tooltip to still allow easy access to more detailed stock information.

Colour of the plot line is now a bar under the stock

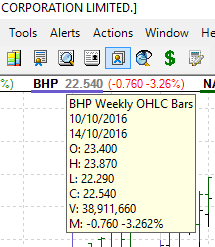
Added a tooltip to the chart header
When you hover a stock symbol the price details are displayed.
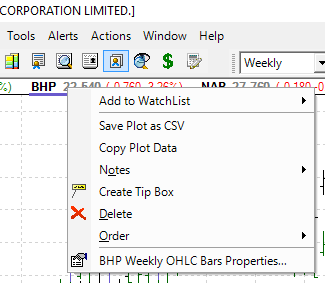
Right hand click on a stock symbol in the header provides action options
Though not a new feature, it is highlighted as part of the overall changes to the chart header.
Click on symbol in chart header to select a plot
Though not a new feature, it is highlighted as part of the overall changes to the chart header. Useful to select a line plot when lines are too close together.

Add watchlist as a chart overlay
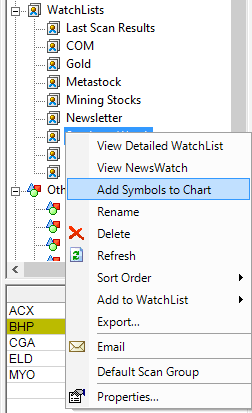
If you wish to overlay stocks on a chart from a watchlist, right hand click on the watchlist and select Add Symbols to Chart. Only the first 20 stock symbols are inserted at a time. The colour of each line will be auto generated which you can change later in Line Properties. The stocks inserted will be based on the sort order of the watchlist.
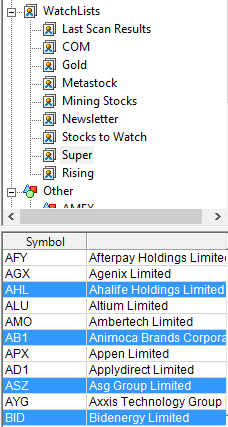
Drag and drop symbols from your watchlist to overlay on the chart
Alternatively multi-select symbols that you want to drag on to the chart.
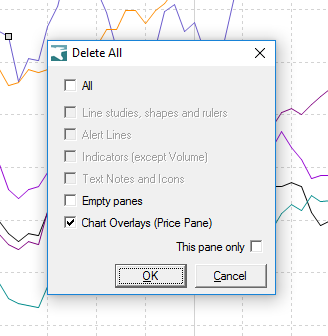
Control + Delete all overlaid symbols
Short cut to remove all symbols from a chart.
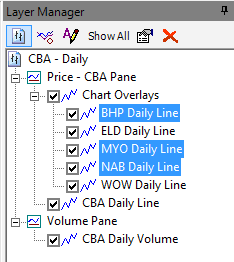
Multiple select available in the Layer Manager
Option to delete multiple items.
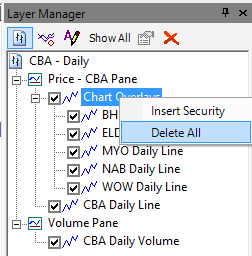
or a Delete All option in Chart Overlays.
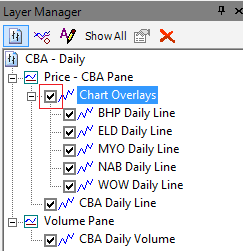
New section for Chart Overlays
Easily group the chart overlays so you can delete, hide or display individual line plots.
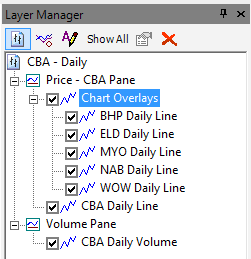
Toggle to hide or display Chart Overlays
Click on the tick box to hide or display all chart overlays.
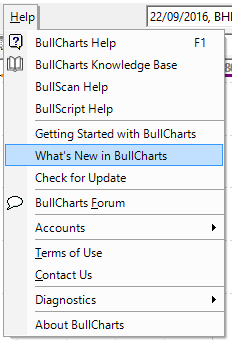
What’s New is now part of the BullCharts Knowledge Base for more timely update on changes.
Add symbol shortcut added to chart header
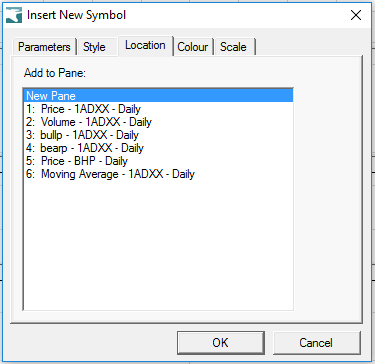
Shortcut to insert a symbol as a chart overlay or in a separate pane.
Symbol overlays on a chart are useful for Comparative Percent Performance analysis.
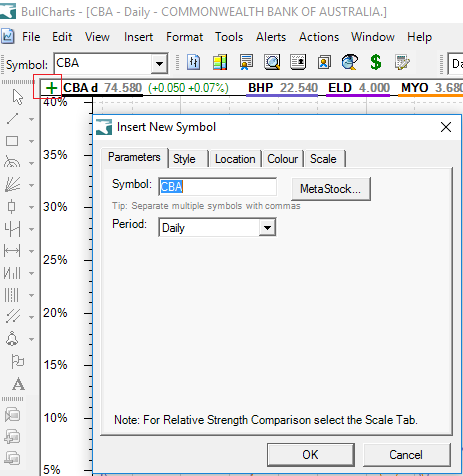
Select the Location tab to insert on the 1. Price Pane for an overlay or a New Pane to display separately.
