Language Overview
BullScript is a functional programming language that is used to define indicators and alerts. It is similar to some spreadsheet languages. The language is made up of functions, such as ma() and atr(), and mathematical operations like +, -, *.
BullScript is not case sensitive, meaning that it does not matter if words are typed in upper case or lower case.
Operators
BullScript provides fourteen basic operators for doing mathematical calculations. These are divided into five arithmetic operators: +, -, *, /, and ^, the six relational operators: <, >, <=, >=, <>, =, and two logical operators: ‘and’, and ‘or’. There is also an operator called the assignment operator, :=, which is used to store a value in a variable.
The operators, in order of precedence, are:
| Operator | Name | Example |
|---|---|---|
^ |
Exponentiation | 3^4 ? 81 |
* |
Multiplication | 4 * 5 ? 20 |
/ |
Division | 20 / 5 ? 4 |
+ |
Addition | 4 + 5 ? 9 |
- |
Subtraction | 4 - 5 ? -1 |
< |
Less Than | 4 < 5 ? true |
> |
Greater Than | 4 > 5 ? false |
<= |
Less Than or Equal To | 4 <= 5 ? true |
>= |
Greater Than or Equal To | 4 >= 5 ? false |
= |
Equal To | 4 = 2+2 ? true |
<> (or !=) |
Not Equal To | 4 <> 5 ? true |
and |
Logical And | Close>5 And Volume>10000 |
or |
Logical Or | Close>5 Or Close<3 |
:= |
Assignment | result := (High + Low) / 2 |
Logical Operators
The AND and OR operators are called logical operators. They are used to combine true/false calculations together.
The expression H>hist(H,1) AND L>hist(L,1) will return true if both the high and the low have increased over the last day.
The OR operator is an inclusive or, which means it returns true if either, or both, of the expressions on each side are true. For example, H>hist(H,1) OR L>hist(L,1) will return true if the high has increased, or the low has increased, or both have increased.
Note in the table above that AND has a higher order of precedence than OR. The
AND and OR operators behave like multiply and plus with respect to each other. For example, the expression: “tea OR coffee AND sugar“ is actually interpreted to be “tea OR (coffee AND sugar)“. Parentheses must be manually added to force the OR to have a higher precedence, such as in: “(tea OR coffee) AND sugar” This may seem counter intuitive at first, but it is standard is most computer languages.
Price Variables
BullScript allows use of special variables to access the open, high, low, and close prices, and the volume of the current bar the formula is being run on. The valid BullScript price variables, and possible abbreviations are shown in the table below.
For example, the formula (H+L)/2 will plot the average of the high and low prices. The formula H+1 will plot a line $1.00 above the high price.
See Also
Security Variables
If you have subscribed to receive data from BullSystems, a number of security details, or fundamentals, are also available such as PE ratio, earnings per share, and industry information.
To reference a security variable, enter the word code Security. followed by the variable to be included. For example Security. PERatio. See below for a table of all security variables.
Important notes regarding security variables
The underlying data for the security variables is a static snapshot. That is, the historical values of that variable are not recorded, and only the latest values are available to BullScript.
Some of the security variables (for example earnings per share) report directly from the fundamentals data stored in the database. Others perform a calculation, such as market cap, which is close * total issue.
If you reference a non-calculated security variable then it will always have the same value for every day being calculated (even if you select a historical date in a BullScan, offset the data, etc). On a chart it will appear as a straight line.
If you reference a calculated security variable then any price variables used to internally make the calculation will be for the current day, but the fundamentals will not change.
The above limitations mean that security variables are only representative of the current day – and therefore must be used with caution. Their primary application is for BullScans on the current day.
Table of security variables
Each of these should be used as Security. Name. Some variables have multiple names, or aliases. Any may alias may be used. Unl
| Security Variable | Description | Units | Calculation* |
|---|---|---|---|
TotalIssue |
Total class issue. The total number of securities of this class quoted on the exchange. | Shares | Non-calculated |
AssetBacking |
Net Tangible Assets as last reported by the company, adjusted for dilution. | $/share | Non-calculated |
EarningsPerShare |
Rolling 12 months earnings per share. | $/share | Non-calculated |
DividendPerShare |
Rolling 12 months dividend rate per share. | $/share | Non-calculated |
CurrentDividendAmount |
Value of most recent dividend (net of witholding tax). | $/share | Non-calculated |
FrankedPercent |
The percentage of the dividend on which tax has already been paid. | % | Non-calculated |
GrossDividendAmount |
Gross dividend amount. | $/share | Non-calculated |
AnnualDividendPerShare |
Total dividend rate per share over the last 12 months, including any special cash or scrip dividend. | $/share | Non-calculated |
MarketCap |
The current capitalisation of this security. | $ | Close*TotalIssue |
EarningsYield |
Earnings per share as a percentage of price. | % | 100*EPS/Close |
PERatio |
Price Earnings Ratio | Close/EPS |
|
DividendYield |
Dividends per share as a percentage of price. | % | 100*DPS/Close |
DividendCover |
Ratio between earnings and dividends. | times | EPS/DPS |
ExDate |
Shares purchased after this date will not receive dividends. | Date | Non-calculated |
DividendPayableDate |
Dividend payments are made on this date. | Date | Non-calculated |
IndustryCode |
8 digit GICS (Global Industry Classification System) industry code. | Text | Non-calculated |
Sector |
Name of GICS sector. First of four levels of classification. | Text | Non-calculated |
IndustryGroup |
Name of GICS industry group. Second of four levels of classification. | Text | Non-calculated |
Industry |
Name of GICS industry. Third of four levels of classification. Not available for many securities. | Text | Non-calculated |
SubIndustry |
Name of GICS sub-industry. Fourth of four levels of classification. Not available for most securities. | Text | Non-calculated |
SectorIndex |
The S&P/ASX200 index symbol for the sector that the security belongs to. Useful when used in conjunction with LoadSymbol. | Text | Lookup |
* Refers to calculations made on underlying data by BullScript.
Example
if( Security.MarketCap > 100000000 and Security.Franked = 100, 1,

0);
See Also
Using ‘If’
An important function in BullScript is the If function. It accepts three parameters. If the first parameter is not zero, then it will evaluate to the second parameter, otherwise it will evaluate to the third parameter.
For example, if you wanted to plot an indicator that is equal to the volume for the bar on all bars where the closing price is greater than the opening price, and is equal to the negative of the volume otherwise, you could use the formula If(close > open, volume, -volume). The If function is very important, because it allows completely different calculations to take place depending on whether a condition is true or not.
See Also
Hist, Future and Previous Functions
Many indicators require use of data before the current bar. The Hist function is useful for accessing data from previous bars. Hist accepts two parameters: the data value being looked for, and the number of bars ago to look at.
For instance, hist(C,1) finds the close price for the previous bar. hist((H + L)/2,8) finds the average of the high and low prices for 8 bars ago.
The Future function is like the Hist function, except that it evaluates bars that are in the future from the current bar being evaluated. For instance, future(C,1) finds the close price for the next bar.
The Previous function is like the Hist function, except that it evaluates to the value of the current formula for a certain number of bars ago, usually the previous bar. Note that the value of the current formula a certain number of bars ago will itself also rely on the value of the formula further bars ago, and so in effect the entire data set can be accessed using Previous.
For example, to add up all the close prices that have occurred, one could use the formula: close + previous(0,1)
The first parameter to Previous is the ‘seed‘. That is, the value to use if there is no previous bar available. The second parameter is the number of bars ago to look at. The most common uses of Previous use 0 as the seed and 1 as the number of bars ago to look at, and so those are the parameters that will be used if no parameters are given. Thus the above formula can be written: close + previous
Previous, Hist and Future are important BullScript functions, and many indicators would be impossible to plot without them.
See Also
Variables
Some indicators require long and complex formulae. To make long BullScript formulae simpler and easier to understand, partial results of a formula can be placed in a variable, and that variable accessed later.
For instance, if one wanted to find the 14-day simple moving average of the typical price (the typical price is the average of the high, low, and close prices), the formula, MA((high + low + close)/3,14,SIMPLE) could be used.
This could be simplified by putting the typical price in a variable:
TypicalPrice := (high + low + close)/3;
MA(TypicalPrice,14,SIMPLE)
For even large formulae, the usefulness of variables is even larger. One may also access variables used in another formula. This is done by placing the name of the formula, followed by a dot ” .” followed by the name of the variable. For instance, if the above formula was called Typical14MA, then the variable could be accessed using Typical14MA.TypicalPrice.
Defining Formulae with Parameters
It is possible to create a BullScript formula that accepts parameters, like many builtin functions do. If you use a formula that accepts parameters, you will be asked to enter the values of the parameters. If you use a formula that accepts parameters like a function, parameters may be given to it in the same way as parameters are normally given to a function.
There are three BullScript functions that facilitate a formula accepting parameters: the Input, Param, and Expression functions.
The Input function will make the formula accept a parameter, and will evaluate to the value of the parameter. The parameter given must be a number, and must not rely on any plot data. For instance, if you wanted to write a formula called AvgAD, which calculates a moving average on the accumulation/distribution (calculated by the standard ad function), your formula might be written as:
MALength := input(“The length of the moving average”);
ma(ad,MALength);
When you try to insert the AvgAD indicator, you will be asked for a parameter with the prompt “The length of the moving average”. If you use AvgAD as a function, you may simply type AvgAD(14), for instance, to find a 14 day moving average of accumulation/distribution. You may not however, type AvgAD(close) since using price variables as the parameter to the Input function is not allowed.
The Param and Expression functions are like the Input function, except that they allow price variables to be given. See the specific notes for each of these functions for more details.
See Also
Expression | Input | Param
Referencing Other Formulae
If you write a formula in BullScript, that formula can be used as a function from another formula. For instance if you wrote a formula (H+L)/2 which you named HLAvg, and you wanted to run it as a function from another formula, you could simply write HLAvg() and it would treat it as a function.
However, functions in BullScript may not contain spaces, or any characters other than letters, numbers, or underscores. They may not begin with a number. If your formula is not named in this way, then it may not be used directly as a function. You can still access it though, using the formula function. The formula function is used to access any formula as a function, and is given the name of the function as its first parameter.
If you named your formula High Low Average, you could write formula(“High Low Average”) to use it as a function from another formula.
See Also
Multiple Plots
A single BullScript formula can plot multiple lines in an indicator. This is done by separating the calculations for each plot by a semi-colon (;). If for instance, you wanted to plot a line $1 above the high price, and another line $1 below the low price, you could use the formula:
High + 1;

Low - 1
A single formula can have an unlimited number of plots.
Comments
BullScript allows you to write comments, or notes, to yourself within a formula by placing the comments in braces: { and }. Comments can be used to make the formula easier to understand when it is read later.
The following example shows how a comment may be used to more clearly indicate what a formula is doing. The syntax highligher will show comments in green:
ma(C,20)

{a 20 day moving average}
BullCharts will completely ignore all comments. Therefore comments can also be a convenient way to temporarialy remove some code while testing your scripts.
Attributes
Using Attributes
BullScript allow you to specify the way you want the results of a script to be displayed within the script itself, using its attributes system.
Attributes are defined within square brackets, “[” and “]”, and appear before the plots that they relate to. They consist of the name of the attribute being used, followed by an “=“, followed by the value of the attribute.
For instance, if you wanted to plot a 28-day simple moving average and a 14- day simple moving average, but you wanted the 28-day moving average to be displayed in green, and the 14-day moving average to be displayed in red, you could use the following code:
[color=green]

ma(C,28,SIMPLE);

[color=red]

ma(C,14,SIMPLE);
If a plot has more than one attribute, the attributes may be seperated by semicolons, or placed in separate sets of square brackets. For example, if you wanted to plot a 14-day moving average in red, on a new pane, you could use,
[color=red;

target=price]

ma(C,14,SIMPLE);
or
[color=red]

[target=price]

ma(C,14,SIMPLE);
Some attributes, such as author and category may take multiple values. All values must be given in the same attribute, and must be separated by pipes. See the table below for details.
[category=Moving Average|Verticality]

ma(C,14,SIMPLE);
Available Attributes
| Attribute | Possible Values | Description | Examples |
|---|---|---|---|
Alias |
Any text | An alternative name by which the formula may be called within BullScript. This will often be an abbreviation. | [alias=MyRSI] |
Author |
Any text (for example Hull, Alan) | The author of the indicator. By convention, use the last name then the first name. Multiple authors may be listed, separated by pipes. | [category=Hull, Alan] |
Category |
Any text (for example Volume) | The category that the formula is in. Multiple categories may be listed, separated by pipes. | [category=Moving Average] |
Citation |
Any text | A reference to documentation on which the formula is based. | [citation="Trading Systems, Wilder"] |
| Color | Colour names or RGB values given as rgb(red,green,blue) | The default colour of the plot. | [color=red] |
Description |
Any text | A description of the formula. This will appear on the Insert Indicator page. | [description="The moving average can be used to smooth noisy |
| FillStyle | Name of pattern to use. See list. | Background pattern for ribbons. | [fillstyle=Weave] |
Font |
Default, or any font name, eg: Verdana, Arial, Wingdings | The font face, or family, used for markers and text plots. | [font="Courier New"] |
FontSize |
Default, or a positive number. | The size of the font in points for markers and text plots. | [fontsize=12] |
FontStyle |
Default, or any of Bold, Underline, Italic or Strikeout separated by commas. | The style of the font for markers and text plots. | [fontstyle=Bold,Underline] |
HorzLine |
List of numbers separated by commas. | Levels at which horizontal lines should be displayed. | [horzline=20,80] |
| LineStyle | Solid, Dotted, Dash, Long Dash, Step, Dotted Step, Horz Step, Bar, Grounded Bar, Points, Marker, Fill, NoPlot, Text. | The style with which the plot will be drawn. | [linestyle=step] |
LinkedChart |
SelectionOnly | If an indicator has this attribute and it is included in a scan, then when a linked chart is created, only selected plots are shown on the chart. | [linkedchart=selectiononly] |
Name |
Any text | The name for an individual plot. | [name=Signal Line] |
Password |
Text | The password must be entered to view or edit the indicator script again – but not to use the indicator. | [password=12345] |
Period |
Daily, Weekly, Monthly, Quarterly, Yearly | The timeframe that this indicator intended for use on. Do not specify if the indicator can be used on any timeframe. | [period=Weekly] |
SortPlots |
ByName | Normally an indicators plots are shown in the properties window in the order they are scripted. This attribute causes them to be sorted by name. | [sortplots=byname] |
| Target | Price, Volume, New Pane, New Axis, Overlay, Percent, Default | The pane and scale that the plot will use by default. | [target=price] |
TextAlign |
Center, Above, Below, Left, Right | Specifies where text is placed relative to a data point. | [TextAlign=Above, Left] |
| TextFormat | Default, other format string | Allows advanced formatting options for displaying dates and numbers as text. | [TextFormat=00 00 00 |
Transparency |
Number between 0 and 100 | Specifies the transparency for a filled linestyle. 0 for completely opaque and 100 for completely transparent. | [transparency=95] |
Visible |
Yes, No | Whether or not the plot is visible by default. | [visible=no] |
Width |
Positive number | The width of the plot line. | [width=2] |
Functions
BullScript contains many functions that perform more complex operations. An example of such a function is the max function, which gives the maximum of two numbers. Functions are run by placing their name followed by parenthesis that contain the parameters being given to the function to operate on. So to find the maximum of two numbers, one could write the formula max(4,C). This would evaluate to 4 if the close price is less than 4, and to the close price otherwise.
Functions accept a certain number of parameters. It’s not possible to write max(5) for instance, since finding the maximum of one number doesn;t make sense. The square root function, sqrt, must have only one parameter though, since finding a square root is performed on one number. Some functions, such as the max function, can take a varying number of parameters. Max must be given at least two parameters, but it could be given three or four parameters, in which case it will calculate the maximum of all the numbers it is given.
There are also function equivalents to the mathematical operators, for example add does the same thing as the + operator. The formula add(C,5) is equivalent to C+5.
The result of one formula may be used as a parameter for another formula. For example, it’s possible to write max(add(C,5),8) to find the maximum of C+5 and 8.
If a formula does not require any parameters at all, such as the atr function, then it may be written with an empty parenthesis after it, like atr(), or the parenthesis may simply be omitted.
Certain functions take special parameters that are not numbers. An example of such a function is the ma function, which calculates moving averages. Its third parameter specifies the type of moving average being calculated, and may have parameters such as simple, exponential, or variable, to indicate the type of moving average calculated. For instance, ma(C,14,exponential) calculates a 14-day moving average of the close price.
Data Types
Numeric Data
Most of the BullScript functions and calculations work with numerical data. However, there are other types of data that some of the functions input or output.
Internally, BullScript uses a type known as the double in computer-speak, which is short for double precision floating point type. While this name may sound like double-dutch, it means BullScript stores each number to 15 digits of precision, and then stores an exponent that can go between 10(+/-)307. This gives it a range well beyond what can actually be drawn on a chart. Note that this may be changed in a future versions of BullScript.
Be aware that because some values such as 1/3 cannot be truly represented by the double, rounding error can accumulate in calculations, despite the high precision used in storing numbers. Particularly in calculations that reuse previous results.
Text Data
In computer terms, text data can also be called a string (short for a string of characters). Text data is surrounded by two double-quotes. Text data can be:
- used as a symbol for the loadsymbol function
- displayed on a chart with the text Linestyle
- shown in a BullScan report
Only the equals, assignment and addition operators work with text data. The addition operator will join two strings together. For example “Bull” + “Charts” returns “BullCharts“.
Note that if numerical data is passed in where text data is expected then the numerical data will be converted to text data. For example, “Price=$” + Close may return “Price=$4.750“. There are also a number of functions, described under the Text Function Reference.
Boolean (Yes/No) Data
Traditionally, boolean data stores one of two states, typically interpreted as true/false, or yes/no. It is named boolean data after George Boole, who contributed much to this area of logic.
In technical analysis, a boolean value is often used to signal some event. For example “Has the price crossed above its 7 day moving average?” is a question that gives a boolean answer. In this case, the BullScript cross(C,ma(C,10,S)) returns the boolean answer for each bar.
Boolean data is typically (but not exclusively) used in one of these contexts:
- the first parameter of the if function, to perform conditional calculations
- to indicate that a marker should be shown on a chart (by using the linestyle attribute)
- as the first result in a BullScan to indicate if a security should be included in the scan results.
BullScript internally stores boolean data as numeric data, where a zero value represents false, and any non-zero value represents true. Many functions that return boolean data return 1 for true. This is significant as it means that if x and y are both boolean values, then the BullScript if(x=y,…) will correctly detect if both are ‘false’, but may not correctly detect if both are ‘true’.
The AND and OR logical operators, along with the anytrue, anyfalse, alltrue, allfalse functions use logic to combine boolean values together.
Date Data
In BullScript, a date value is data that contains date and time information. That is, the one value holds a number for each of year, month, day, hour, minute and second.
Date values can be created by using one of the following functions:
Date returns a date value of a specifically defined year, month, day.
InputDate shows a date input box in the indicator window, as well as a vertical bar that can be dragged around on the chart.
Now returns the date value of the bar BullScript is currently processing.
SystemDate returns a date value (date and time) according to your computers clock. That is, today.
The individual components on a date value can be extracted and converted into numerical data using the functions Year, Month, DayOfMonth, DayOfWeek, Hour, Minute and Second. There are several other functions for working with dates, described in the Date and Time Function Reference.
Enumerations
Enumerations are data that describe one of a set of discrete values. BullCharts currently supports a moving average type enumeration, with values like ‘simple’, ‘exponential’, and so on. It also has a rate of change type enumeration, with the two values ‘points’ and ‘percent’.
The former is selected using the inputma function, and used by the ma function. The latter is selected using the inputroc function, and used by the roc function.
Undefined
Undefined is a special value used when a result cannot be calculated, or that a result is not meaningful in the current context. It is not strictly a data type, as undefined can be returned in place of any of the other data types.
The two most common reasons for an undefined result are that either there is insufficient data to perform the requested calculation (for example, a 10-day moving average will return undefined for the first 9 days), or because some value has been divided by zero (which is quite common when performing calculations involving the trading range, or volume).
The undefined keyword can be used to indicate that you don’t want a result to be defined for some reason or another. It is used to force BullCharts to not draw a line on the chart at a certain point.
Candle Patterns
BullScript contains a number of functions designed to autmatically detect candlestick patterns. These functions can typically be called without any parameters, and will return 1 (true) when the candle patterns is present, and 0 (false) at all other times.
Specifically, the patterns will return true when the pattern is present and the last bar of the pattern is the bar being processed.
A list of candle pattern functions is as follows:
Displaying Text
BullCharts normally draws formulas as a chart line. However, it is possible to create formulas that show text on a chart.
The key components to drawing text are:
- Determining what the text should be
- Determining what day(s) to show the text on
- Determining what how high on the chart to show the text
To draw text, set the LineStyle attribute to Text. Then two calculations need to be provided. The first determines the text (if any) to be drawn for that bar, and the second determines the y-position of the text (in dollars, or what ever unit the y-axis is using). If either of these calculations returns undefined then no text is drawn.
Calculations must appear in pairs until the linestyle is changed to something else, or the end of the script is reached.
Other aspects of text can also be controlled using the Font, Colour, FontStyle, FontSize and TextAlign attributes. Refer to the help pages on these attributes to learn more.
When creating text (often called strings) you specify some text directly by enclosing it in quote marks “such as this“. The BullScript editor will colour these Aqua. Strings can joined together by using the +operator. Remember to include spaces when joining strings. So “This” + “ and that” will give “This and that“. Numeric values can also be joined to strings. For example “The price is “+Close might show “The price is 3.75“.
Strings can be used in conjunction with some other BullScripts such as the if statement. The code if(C>O,”Close”,”Open”)+” is bigger” will either say “Close is bigger” or “Open is bigger” depending on their values.
Example 1
The following BullScript will write the word ‘Hello’ above the high price of the 20th bar on the chart.
[target=Price] [linestyle=Text; textalign=Above,Center] [font="Times New Roman"; fontsize=30; fontstyle=Bold]

if(barnumber=20,"Hello",undefined);
High;
Example 2
This chart can be created with the script shown below.
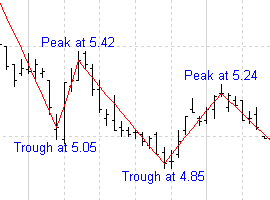
[target=Price]
size := input("Zig zag size",4,0);
z := zigzag(Close,size,%);
ispeak := z>hist(z,1) and z>future(z,1);
istrough := z<hist(z,1) and z<future(z,1);

[linestyle=Solid; color=Red]
z;

[color=Blue] [linestyle=Text; textalign=Above,Center] if(isPeak, "Peak at " + z, undefined);
High;

[linestyle=Text; textalign=Below,Center] if(isTrough, "Trough at " + z, undefined);
Low;
See Also
Attributes | Colour | Font | FontStyle | FontSize | LineStyle | TextAlign