Many technical analysts like to include a “Moving Average of Momentum” on the Momentum indicator on their price chart. On a weekly chart of the All Ordinaries (XAO) index, it could look like the example below.
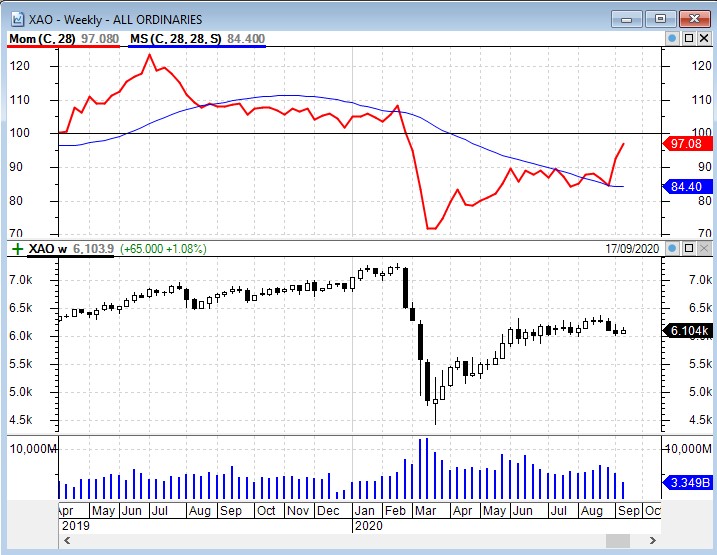
In this example chart, the Momentum is the red jagged line in the upper pane, and the Moving Average (MA) of the Momentum is the gently curving blue line.
In BullCharts, the MA of Momentum is available as a standard indicator, but it is called SMOOTHED MOMENTUM. Hence the abbreviation in the pane title bar shows “MS(C,28,28,S)”.