With a price chart of an Australian security, it is possible in BullCharts to add a vertical line to the chart to indicate the latest ex-dividend date. This is a standard chart indicator, and can be added in the same way as any other chart indicator. In BullCharts it’s actually referred to as “Dividend Vertical Lines”. This indicator is in addition to the “ExDate Vertical Line” indicator which shows only one vertical line for just the ex-div date.
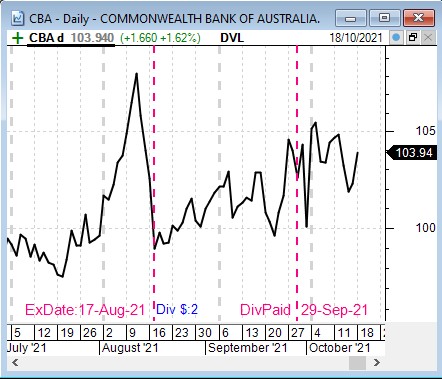
An example of the Dividend Vertical Lines indicator is shown in the first screenshot at right, which shows the CBA ex-dividend date as a dotted vertical line on 17 August 2021, the dividend amount, and a second dotted vertical line to indicate the Dividend Paid date.
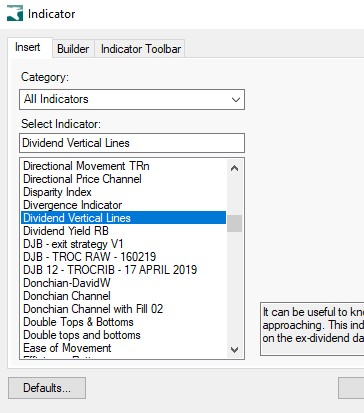
How to insert the “Dividend Vertical Lines” indicator – Simply use the BullCharts menu option: Insert > Indicator. Then to find this indicator, in the dialogue box make sure to select “All Indicators” in the first drop-down (see the second screenshot at right), then scroll down to the entries that start with the letter D. In the attached screenshot there are more indicators in this BullCharts system than what is supplied, but you should be able to find one in your list that says: “Dividend Vertical Lines“.
Remember that in many cases, the next ex-dividend date for a stock is often not announced until a few weeks prior. So if you are looking forward to the ex-div date for a stock, you might not be able to find the exact date until closer to the date. Nonetheless, the BullCharts database contains about 19 Fundamental value fields, one of which is the last ex-dividend date.
Tweak the parameters – Like other chart indicators in BullCharts, and in fact many chart elements, you can tweak the indicator properties.
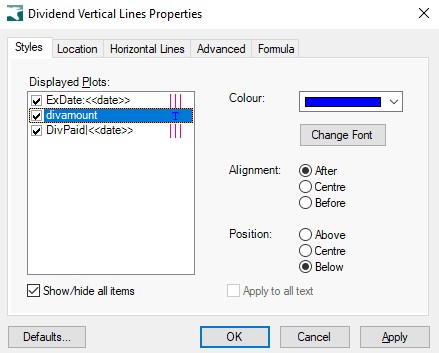
For this indicator, when viewing the indicator properties and the Styles tab, you can tweak various attributes for each of the: ExDate vertical line, the Div Amount, and the Div Paid date vertical line. For example, you can change the thickness of either of the vertical lines, or the style from solid to dashed (so as not to obstruct any price or volume data).
You can also tweak the vertical location of the Dividend Amount. In the screenshot at right, note that when the “divamount” item is selected, you can change the vertical Position of this by small amounts to be Above, Centred or Below the other text items across the chart.
Author: Robert Brain (aka Brainy)
Australian BullCharts User Group convenor