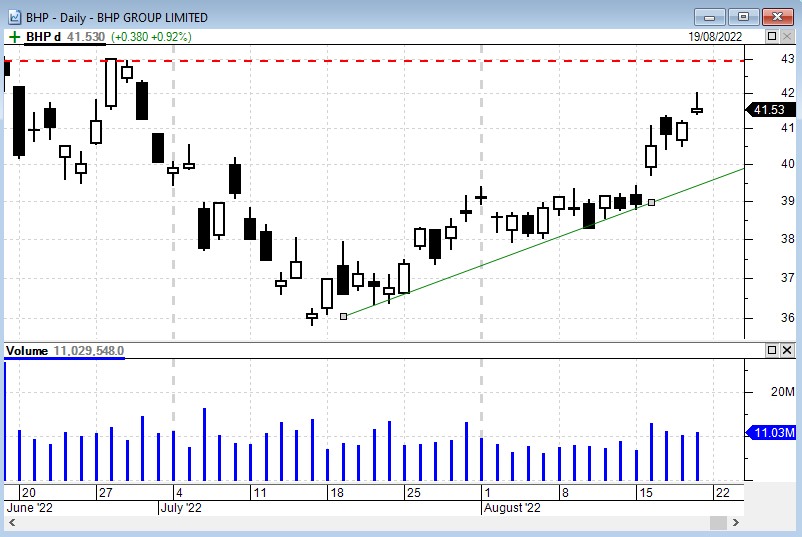
By default, there might be just a few days of “space” between the right hand end of your price chart and the price axis, and you might wish to display more space so that you can extend various chart elements into the future. For example, in the daily candlestick price chart of BHP below, you might want to see where the dotted, red horizontal resistance line will meet the upward sloping, green trend line. On this chart, the intersection point is out of view.
Changing the “space to right” of chart
There are two ways to change the amount of space to the right of your price chart:
- Use the menu option: Format > Space to the right… or
- Right click anywhere along the time axis, and from the drop-down menu select: Time Axis…, then enter a different value for “Space to the right of the chart”.
Saving the revised change
Having changed the value for “Space to right”,you will want to make this your default value to be applied the next time you create a new chart. So make sure to also tick the box “Set as my default”. The other option is to set the desired amount of space on your Default Template, and then re-save your Default Template.