It is normal to display the volume pane in the price chart, usually at the bottom of the price chart. But sometimes you might want to hide the volume plot. This Knowledgebase article explains how to show/hide the volume plot as well as customise the volume pane features.
To show/hide the volume pane
There are a couple of ways to hide / show the volume pane as follows:
- Right-click on the price chart, or the volume pane, of select “Volume pane” from the drop-down menu.
- To hide the volume pane, simply click on the small cross in the top right corner of the pane to close it, just like you would to close an indicator pane.
Volume Properties
The Volume appearance can be modified through the Volume Properties dialogue box. Double click on any volume bar in the Volume pane, or right-click on any volume bar and select “…Volume Properties”. Make sure to double-click or right-click exactly on a volume bar, otherwise you will get a different drop-down menu.
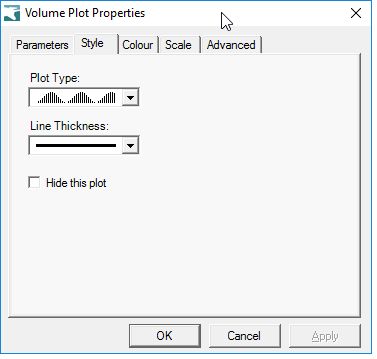
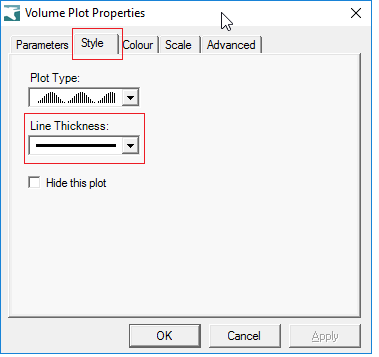
Changing volume bar appearance
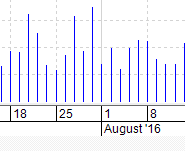
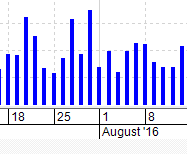
To change the Line thickness, for example, select the Style tab, then Line Thickness. Select Apply. In the following screen shot, the volume bars before, and after, the change are shown.
Change the colour of the volume bars
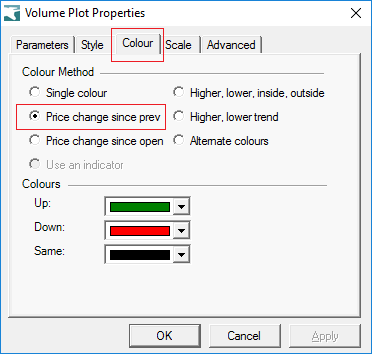
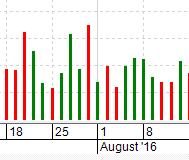
There are a few different ways to apply colours to the volume bars, as shown in the screen shot below. In the Volume Plot Properties, select the Colour tab, then Colour Method. Price change since since previous is a useful indicator. Select Apply.
Move the volume pane up or down
By default, the volume pane is normally shown below the price pane. You can move the volume pane to above the price pane, and if indicator panes are also displayed, you can move any of these panes up/down. Simply right click on a blank portion of any pane and from the drop-down menu select: Panes > Move Pane to display the “Change Pane Order” dialogue box. Use the controls in this box to select a pane and “Move UP” or “Move Down” in sequence.
Overlay volume on the price plot
Some people prefer to have the volume bars on the price plot. To do that, follow these steps:
- Choose the “Insert Indicator” option, either from the menu: Insert Indicator, or using the keyboard shortcut: <Ctrl>+i
- Identify the “Volume” indicator in the list of indicators, and click on “Next”.
- On the “Location” tab, select the “Price…” pane, and the Indicator Scale as “… new…”.
- Customise any other desired features of the volume bars using the other tabs in the Volume Properties dialogue box.
- Click on “OK” to apply this to the chart.