Overview
BullCharts includes a wide variety of technical indicators based on a broad selection of trading strategies, so that whatever strategy you choose, you can use BullCharts to help you make the most of it. Indicators can be overlaid on another chart, added as a new pane, or added as a ribbon across the bottom of the chart. Each indicator comes configured with the most common settings, or you can fine-tune them for your own specific strategies. Furthermore, you can customise standard indicators or even create your own.
Getting Started with Indicators
Inserting indicators with BullCharts is very simple. Here’s a step-by-step guide to inserting the Bollinger Bands indicator.
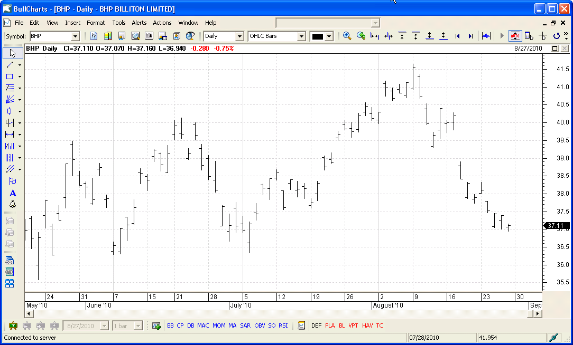
Step 1: Make sure you have a price chart open.
Step 2: From the Insert menu, choose Insert Indicator
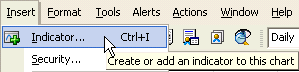
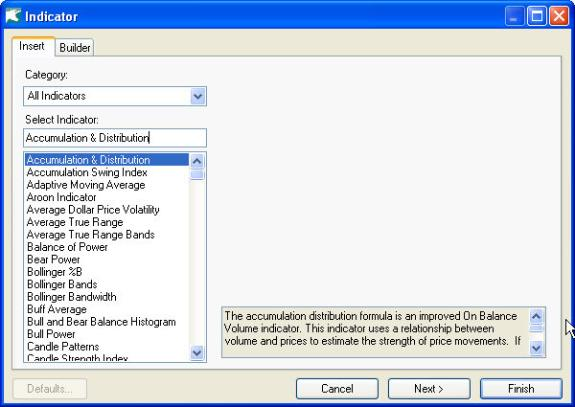
The Indicator Dialog should appear.
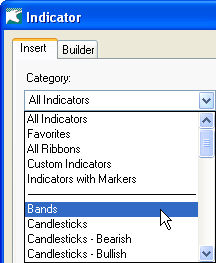
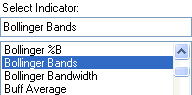
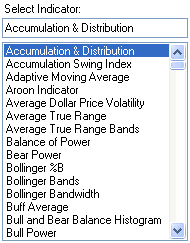
Step 3: In the list at the top-left of the Indicator dialog, choose “Bands” so that only band-indicators are displayed.
Step 4: In the list of indicators, select “Bollinger Bands”.
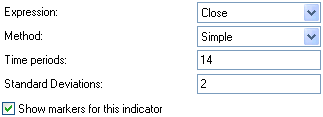
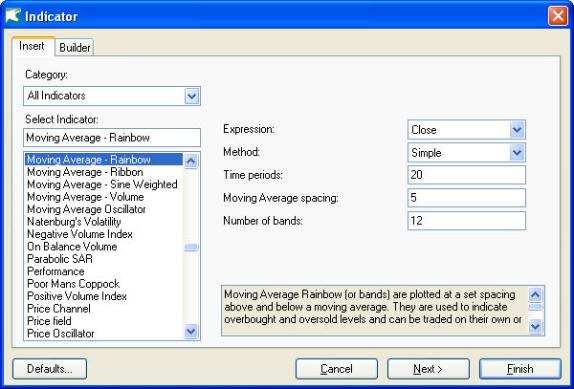
Step 5: The various parameters for the Bollinger Bands indicator appear on the right. Make any adjustments you want.
Step 6: Click the “Finish” button in the lower-right-hand corner.
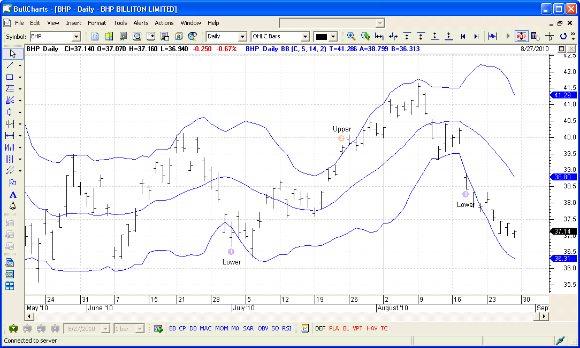
Step 7: Your new Bollinger Bands indicator should appear, overlaid on top of the price chart.
Inserting Indicators
This is an in-depth description of BullCharts’ indicator insertion capabilities. For a quick, step-by-step guide to inserting an indicator, see “Getting Started with Indicators” above.
Opening the Indicator Dialog
To open the Indicator dialog, have a chart open, then go to the Insert menu and choose “Insert Indicator…”

The Indicator Dialog should appear.
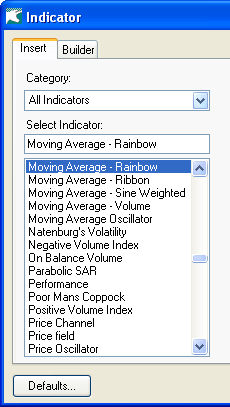
At the top of the Indicator dialog there are two tabs: “Insert” and “Builder”. The “Builder” tab is documented under “Managing Indicators” below, while the “Insert” tab is documented here.
Choosing an indicator
BullCharts comes with a very large number of indicators, and allows you to create as many new indicators as you like. To help keep your indicators organised, BullCharts categorises them, as well as allowing you to search the list of indicators to find the one you want.
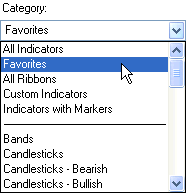
The most important control to use when selecting an indicator is the Category control at the very top of the dialog. When you click on the Category list, it expands to display a list of all indicator categories. Next to each category is the number of indicators in each.
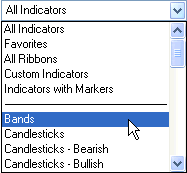
The first four categories on the list are special, because they are controlled by BullCharts.
All Indicators displays every indicator BullCharts knows about, both custom and predefined.
All Ribbons only displays indicators which produce a ribbon. A ribbon indicator is displayed in its own pane, like this:

Custom Indicators only displays indicators which you have created, and hides all the indicators supplied with BullCharts. If you have not created any indicators yet, the result will be an empty list.
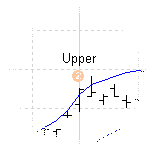
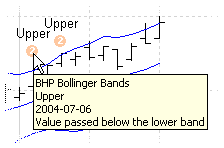
Indicators with Markers only displays indicators that can produce markers. Markers are small symbols placed on a price plot to indicate certain events, like this:
The remaining categories are defined by the indicators themselves. The BullScript source for each indicator can label it as belonging to a particular category, so BullCharts scans through the available indicators and groups them together according to their category labels. Each category found is added to the Category list below the divider, and selecting that category from the list will display all the indicators of that category in the Indicator List.
Once you have selected a category, all the indicators belonging to that category will appear in the Indicator List. Here, the ‘Moving Average’ category has been selected:
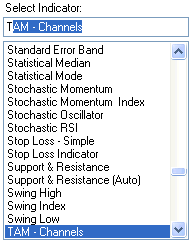
To find a particular indicator in the selected category, start typing the name of security into the text box above the Indicator List. BullCharts will automatically search the indicator list as you type, and scroll the list to the first indicator in this category that begins with the text you’ve typed. For example, if you type “T”, the Indicator List will jump to “TAM – Channels”, the first indicator that begins with T:
Customising an indicator
Once you have selected an indicator, BullCharts will display various controls for that indicator on the right. The controls at the top allow you to customise the behaviour of the indicator, while the box below shows any notes and attributions included in the indicator.
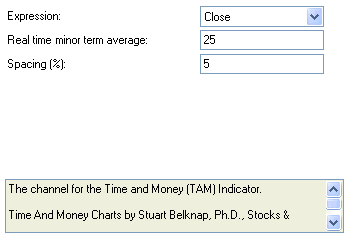
When the indicator’s controls first appear, they will be set to sensible values. If you set new values, they will not be remembered when you next insert the same indicator.
Inserting the indicator
When you have finished configuring the indicator, press one of the three buttons at the bottom of the Indicator dialog.
Cancel will forget all your choices, close the dialog, and do nothing.
Next will allow you to change some advanced settings before inserting the indicator. These settings are described under “Indicator Properties”, below.
Finish will close the Indicator dialog and insert your chosen indicator immediately.
Changing the position of where the Indicator is inserted
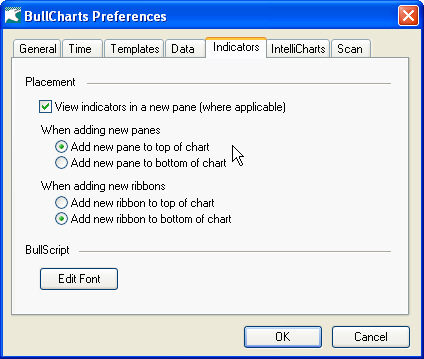
Intelligent defaults have been set to insert an Indicator in the most appropriate window. For example, Moving Averages, are normally overlaid on the Price Plot window pane. However, the default for other Indicators is to insert a new window pane at top of the window. Some users may prefer to insert new Indicators at the bottom of the window. To change the default position, select Preferences from the Tools menu. Next select the Indicators tab, click the option ‘Add new pane to bottom of chart’, then Apply.
Indicator Toolbar
You are able to create your own list of indicators in Favourites and display then on the Indicator Toolbar. To modify the indicator toolbar, go to Insert then Indicators. Select the Builder Tab. Each Indicator has an option to include on the toolbar.
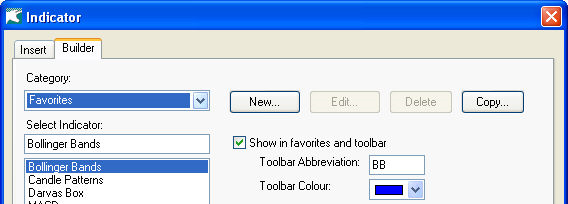
The indicators on the toolbar are part of the category Favourites in your Indicator list.
Managing Indicators
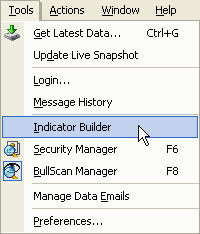
To manage BullCharts indicators, including creating, editing and removing indicators, you need to use the Indicator Builder. You can get to the Indicator Builder by going to the Insert menu (if it is currently visible), choosing “Insert Indicator” then clicking on the “Builder” tab, or by going to the Tools menu and choosing “Indicator Builder”.
The Indicator Builder
The Indicator Builder has two main parts: the list of indicators on the left, and the action buttons on the right.
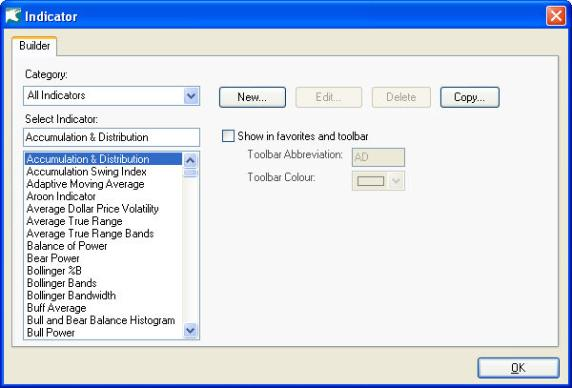
The list of indicators on the left functions in exactly the same fashion as in the Insert Indicator dialog. For more details, see “Choosing an Indicator” under the section “Inserting indicators” above.
On the right there are four action buttons.
New creates a new indicator.
Edit allows you to edit an existing indicator.
Delete deletes an existing indicator.
Copy duplicates an existing indicator so that you can customise it.
Note that you cannot edit or delete any of the indicators that come with BullCharts, you can only edit or delete indicators you have created yourself. However, if you select a built-in indicator and click “Copy” you will create an exact duplicate of that indicator which you can edit.
When you have finished managing indicators, you can click the “Close” button at the bottom of the window to return to BullCharts.
The Script Editor
When you click the “New”, “Edit”, or “Copy” buttons in the Indicator dialog, you will be taken to the Script Editor. The Script Editor is where all BullScript formulae are edited, whether they will be used as indicators or as scans.
- If you clicked “New”, the Editor will be empty, except for a new indicator name.
- If you clicked “Copy”, the Editor will contain the BullScript for the original indicator, and the indicator name will have a numeric suffix added to distinguish it from the original.
- If you clicked “Edit”, the Editor will contain the BullScript and the name of the indicator you are editing.
No indicators will be created or changed until you click the “OK” button in the editor.
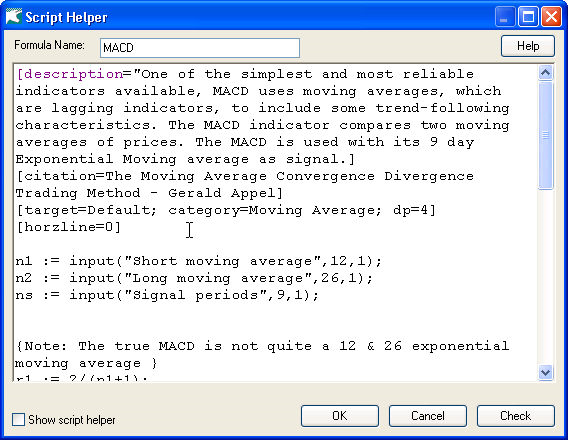
Formula Name
At the top of the Script Editor is the Formula Name field.
If you are creating a new indicator, or copying an existing indicator, this is how you edit its name. If you are editing an existing indicator, altering this field will cause the indicator to be renamed. If you try to use a name already used by another indicator in your copy of BullCharts, you will get an error message when you try to save your changes:
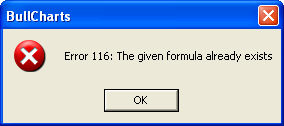
Just change the name of your new indicator and try again.
Formula
Below the Formula Name field is the actual content of the formula, written in BullCharts’ built-in scripting language, BullScript.
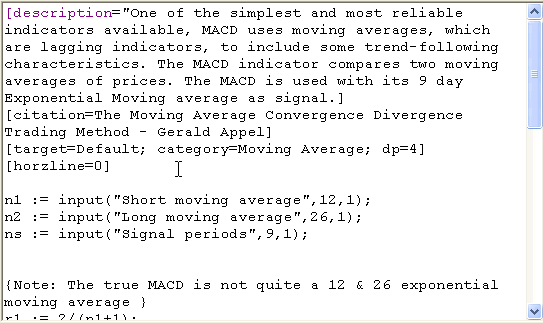
All the standard editing functions are available from the right-click menu. For more information on BullScript and how to create and edit indicators, see the BullScript User’s Guide.
Show Script Helper
At the bottom of the Script Editor, there is a checkbox labelled “Show Script Helper”.
Ticking this box expands the Script Editor and reveals the Script Helper, which is a quick reference for the most important features of BullScript. If you untick the box, the Script Editor will shrink back to its previous size.
Script Helper
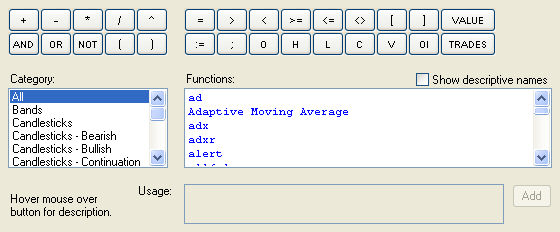
The blocks of buttons directly below the script insert mathematical operators (like multiplication, subtraction, greater than, less than, etc) and basic price functions (like Open, High, Low, Close, Volume etc). Clicking each button inserts the text on the label into the indicator at the current cursor position. For a longer description of each item, hover the mouse over the button for a second and a yellow tool-tip should appear.
Below the blocks of buttons are two lists which allow you to browse the available indicators, in case you want to include them in your own indicator. The list on the left shows all the categories of indicators that have been defined. Choosing any category displays all that category’s indicators in the list on the right.
The list on the right contains the names of indicators in the selected category. Clicking on an indicator in the list displays a sample of how to use that indicator in BullScript, below. When an indicator is selected, you can click the “Add” button to insert it into the script at the cursor position.
Above the list on the right is a small box labelled “Show descriptive names”. If this is ticked, then the indicators in the list will be listed by their longer, more descriptive names. If the box is not ticked, indicators will be listed by their short names, which are easier to work with in BullScript. If an indicator has no short name, its long name will be used instead. The usage sample and the code inserted by the “Add” button will always use the short name, if any.
Indicator Properties
Every indicator can be customised. Line size and colour can be changed, fixed lines can be added, and you can even control where the indicator will be placed.
Note: Every indicator will be automatically placed in an appropriate position, and every indicator apart from ribbon indicators can be manually placed into an existing chart pane or a new chart pane. However, once an indicator is placed, it cannot be moved to a different pane.
How to access Indicator Properties
- In the Indicator Dialog (see “Inserting Indicators” above), once you have chosen an indicator you can click the “Next” button to display the Indicator Properties for that indicator. Note that the Location pane (and hence, the ability to insert an indicator into a pane other than the default) only appears when the Indicator Properties are accessed in this way.
- Once an indicator is inserted into a particular pane, you can click on the indicator to select it, then choose the first item in the Format menu. Note: For Ribbon Indicators, the first item in the Format menu is disabled and you must choose “Ribbon Pane” lower down in the Format menu.
- Once an indicator is inserted into a particular pane, you can right click on the indicator and then choose the appropriate “Properties” entry from the menu that appears. Note: For Ribbon Indicators, choose the item that ends with “Ribbon Properties”.
- Indicators that can be overlaid on another plot (all but ribbon indicators) have their abbreviation displayed in the pane title bar (some panes may have their title bars hidden, but they can be shown via the Pane Properties dialog). You can access the indicator’s properties by double-clicking on the indicator’s abbreviation in the title bar, or right-clicking on the abbreviation and choose the appropriate “Properties” entry from the menu.Note: This is very useful if you have accidentally hidden all the components of an index (see the “Styles” tab, below).
-
Once an indicator is inserted into a particular pane, you can double-click on the indicator.
Location
The Location pane allows you to control whether an indicator will be inserted into an existing pane or into a new pane. It also allows you to choose whether the indicator will be attached to the left-hand scale, the right-hand scale, or neither.
The Location pane only appears when you click “Next” in the Indicator dialog. It is never displayed for an indicator that has already been inserted, and it is never displayed for ribbon indicators.
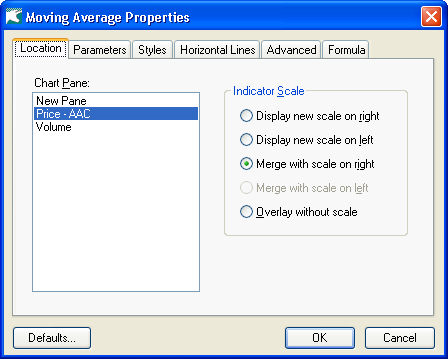
Chart Pane
The “Chart Pane” list includes all the non-ribbon panes in the current chart, as well as the special item “New Pane”. Choosing “New Pane” causes the indicator to be inserted into a new pane, while choosing any of the other panes causes the indicator to be inserted into that pane.

|
|
||

|

|
Indicator Scale
The “Indicator Scale” options allow you to choose what scale the indicator should be drawn against. Each pane can display up to two scales (a left-hand scale and a right hand scale). Each item in the pane can be displayed on the left scale, the right scale, or can be displayed on its own scale, unrelated to the other items on the pane.
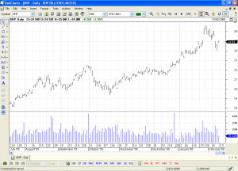
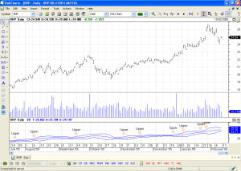
The following screen-shot shows the original chart before any indicators are inserted:
Display new scale on right causes any plots currently attached to the right-hand axis to switch to “Overlay without scale” mode. A new scale is created on the right, and the new indicator is drawn on it. If the right-hand scale is currently hidden, it is revealed.
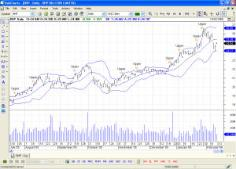
The following picture shows the original chart, with a Stochastic Oscillator indicator inserted into the Price pane in “Display new scale on right” mode:
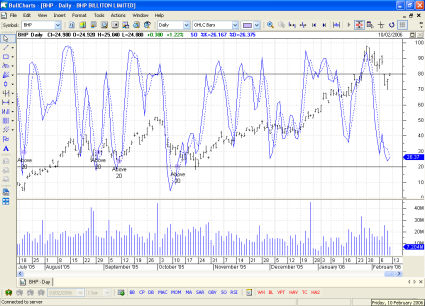
Notice that the price scale on the right has been removed, and the scale now only shows the 0-100 values of the indicator. The price plot is still visible, but has no scale.
Display new scale on left causes any plots currently attached to the left-hand axis to switch to “Overlay without scale” mode. A new scale is created on the left, and the new indicator is drawn on it. If the left-hand scale is currently hidden, it is revealed.
The following picture shows the original chart, with a Stochastic Oscillator indicator inserted into the Price pane in “Display new scale on left” mode:

Note that the price scale on the right is still present, and a new scale has been added on the left to display the 0-100 values of the indicator.
Merge with scale on right causes this indicator to be drawn on the same scale as any other plot drawn on the right-hand axis. Specifically, if the right hand axis is in auto-scale mode, then it will automatically scale to include the new indicator, too. This option is not available if you are inserting the indicator into a new pane, or a pane that has no scale on the right.
The following picture shows the original chart, with a Stochastic Oscillator indicator inserted into the Price pane in “Merge with scale on right” mode:
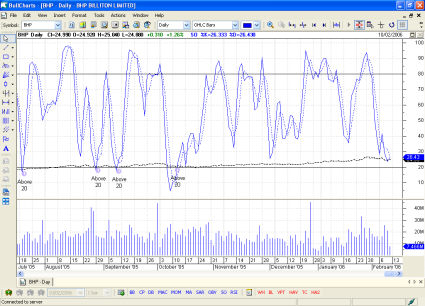
Note that both the indicator and the price plot are plotted on the same axis. Because they have very different typical values (the indicator ranges from 0 to 100, while the price hovers around $12), this is not a useful chart. However, if your indicator’s typical value is very similar to the security price (most moving-average based indicators, for example), then this is a useful mode.
Merge with scale on left causes this indicator to be drawn on the same scale as any other plot drawn on the left-hand axis. Specifically, if the left hand axis is in auto-scale mode, then it will automatically scale to include the new indicator, too. This option is not available if you are inserting the indicator into a new pane, or a pane that has no scale on the left.
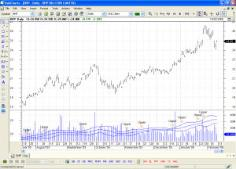
The following picture shows the original chart, with a Stochastic Oscillator indicator inserted into the Price pane in “Display new scale on left” mode, and then a “Moving Average” indicator inserted into the Price pane in “Merge with scale on left” mode:
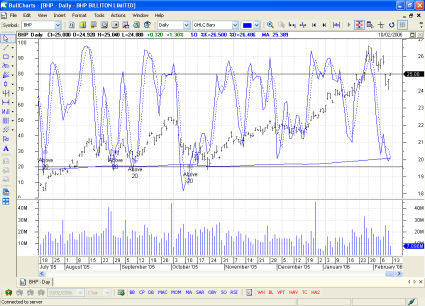
Note that the price axis is displayed on the right, and the indicator’s axis is displayed on the left. Although the Moving Average indicator produces values similar to the security’s price, since it has been forcibly merged with the scale on the left, the Moving Average is a thin blue line at about 12 on the left axis.
Overlay without scale causes the indicator to be added to a new, invisible axis. This new axis is always auto-scaled by default, although it can be toggled by the auto-scale button on the tool bar.
The following picture shows the original chart, with a Stochastic Oscillator indicator inserted into the Price pane in “Overlay without scale” mode:
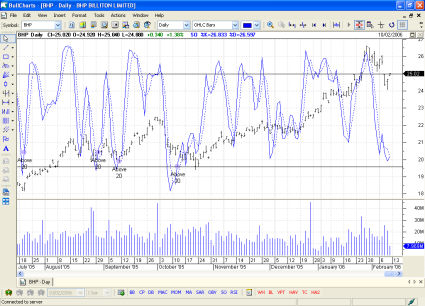
Note that the price scale on the right is still present, but the indicator does not have any scale displayed at all.
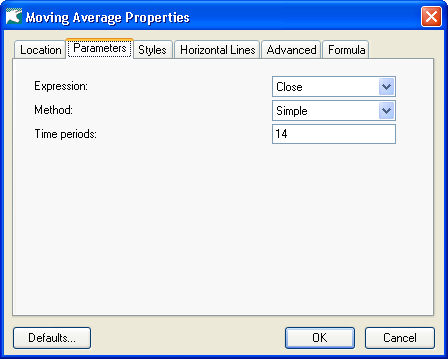
Parameters
The Parameters tab allows you to alter any parameters that the indicator has exposed. For example, the Moving Average indicator lets you choose whether to work on the open, high, low, or close prices, whether to use a simple or exponential moving average, the number of time periods to average, and vertical and horizontal shift values among others.
The Parameters tab is only available for indicators that have parameters.
The settings displayed in the Parameters tab are entirely dependent on which indicator you are inserting, and this tab is an exact duplicate of the parameters pane displayed in the Indicator dialog (see “Customising an indicator” in the section “Inserting Indicators” above).
Note that additional parameters that are available to every indicator appear in the Advanced tab.
Styles
There are two variants of the Styles tab: The first appears for most indicators, and allows you to customise the appearance of lines and markers for each indicator. The second only applies to Ribbon indicators, and allows you to customise the various areas of the ribbon.
The Styles tab is always available.
Styles for Non-Ribbon Indicators
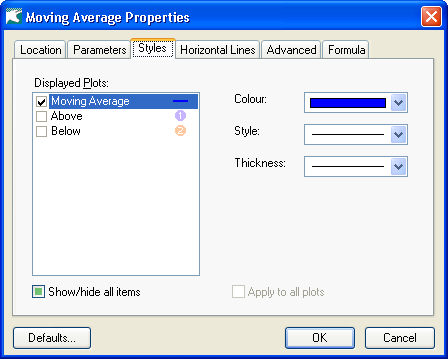
On the left is a list of all the lines and markers drawn by the selected indicator. Each item has a small preview on the right, and tick on the left if it is visible. Each item that has a name attribute in the BullScript source is shown with its name, unnamed items are named after the indicator. You can tick or untick the box next to each line in the list to hide and show lines individually.
Below the list of lines is a box labelled “Show/hide all items”.
- If all items in the list above are shown, this box is ticked (
 ) and clicking on it hides all the items in the list.
 - If all items in the list above are hidden, this box is unticked (
 ) and clicking on it shows all the items in the list.
 - If some of the items in the list above are shown and some are not, this box is indeterminate (
 ), and clicking on it hides all the items in the list.
Styles for different plot types
Each indicator is made up of one or more plots, or data columns. A plot may be one of the following: normal line plot, a marker/signal, text label, filled area. All of the plots are listed on the left. The properties that appear on the right apply to the selected plot only, and vary depending on the type of the plot.
If you select the “Apply to all” checkbox, then any changes you make to the currently selected plot will also be made to other plots of the same type. (For example, if the current plot is a marker, then all marker plots will be updated). You must select the “Apply to all” checkbox before making any changes.
Styles for Normal Line Plots
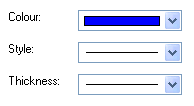
Colour allows you to customise the colour of the given line.
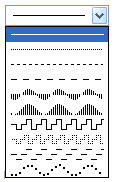
Style allows you to choose various line styles:
Line Thickness allows you to choose the thickness of this line.
Styles for Markers
If you select a marker in the “Displayed Plots” list, the following controls are displayed on the right:
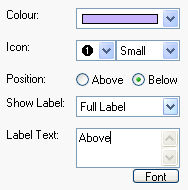
Colour allows you to customise the colour of the icon used to display the marker.
Icon allows you to customise the shape of the icon used to display the marker. You may choose from the following icons:
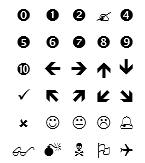
You can also adjust the icon size using the drop down to the right of the icon.You may choose from “Tiny”, “Small”, “Medium” and “Large”.
Position: “Above Line” causes the marker to be drawn just above the High price on a given day, while “Below Line” causes the marker to be drawn just below the Low price. Neither option is very useful for indicators that are not plotted against the Price axis in the Price pane.
Show Labels causes the name of the marker to be displayed next to each marker. You can select “Full Label” to show the label text, “Abbreviate” to show an automatic abbreviation of the label text, or “No Label”. The text and font can be set using the options immediately below.
Styles for Fill Plots
Many indicators, such as the Ichimoku and the Darvas Box have a shaded or filled region that is bounded by two other plot lines. The fills are able to switch between two different colours, depending on which line is on top.
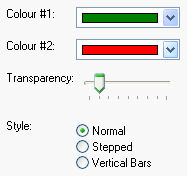
Colour #1 is the colour of the fill when the first bounding plot is on top.
Colour #2 is the colour of the fill when the second bounding plot is on top. When the two plots do not cross, only one of these colours will take effect.
Transparency sets the transparency of the fill. Move the slider to the left for completely transparent, and right for completely opaque.
Style sets the shape of the fill. Use normal if the bounding lines are diagonal lines, e.g. for moving averages. Use stepped if the bounding lines are also stepped. e.g. for the Darvas Box. Vertical bars does not draw a fill, rather it connects the first data point to the second data point to draw vertical lines.
Styles for Text Plots
Some indicators, such as the Darvas Box calculate and draw text onto the chart. This is done with text plots. The following options are available:
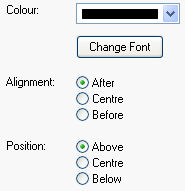
Colour is the colour of the text.
Alignment is the horizontal alignment of the text, relative to the bar that the text applies to. After draws text to the right of the bar, and before to the left of the bar.
Position is the vertical alignment of the text, relative to the bar that the text applies to. Above draws the text above the calculated price point, and below draws the text below the calculated price point.
Styles for Ribbon Indicators
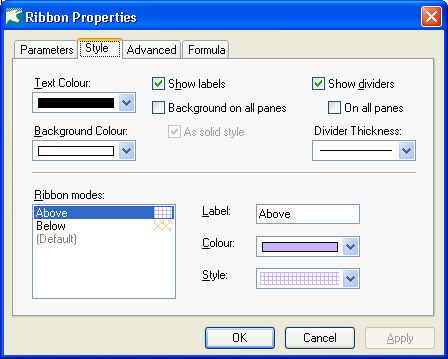
The top half of the Ribbon version of the Style tab contains settings that apply to the entire Ribbon pane.
Text Colour controls the colour of the label on each segment of the ribbon. Obviously, it has no effect if “Show Labels” is not ticked.
Background Colourdetermines the background of the entire Ribbon pane. This colour will underlie the patterns of all the various Ribbon segments.
Show labels determines whether the various segments of the ribbon will be labelled. The label for each kind of ribbon segment is controlled via the “Ribbon Modes” list below. Note that a label is never shown for a segment too narrow to contain the entire label. To see the labels for narrow segments, try using the Zoom tool to magnify the time axis.
Show dividers causes thin black lines to be drawn between each segment of the ribbon. This is useful if you have multiple kinds of ribbon segment with the same colour and style.
On all panes causes the dividers between each segment of the ribbon pane to be drawn on every pane in the chart.
- The dividers on other panes are not drawn in black, they are drawn in the segment colour defined via the “Ribbon Modes” list below.
- If you have multiple ribbon panes in a chart, ticking “On all panes” on one ribbon indicator automatically unticks “On all panes” for all the other ribbon indicators.
- This box is not available if “Show Dividers” is not ticked.
Background on all panes causes the colour and pattern of each ribbon segment to be drawn onto the background of every pane on the chart.
- The colour used on other panes will not be exactly the same as the colour used on the ribbon: it will be slightly transparent over the background of the other panes.
- If you have multiple ribbon panes in a chart, ticking “Background on all panes” on one ribbon indicator automatically unticks “Background on all panes” for all the other ribbon indicators.
As solid style causes the background on other panes to be drawn as a solid colour, and ignore the pattern specified via the “Ribbon Modes” list below.
-
The colour used on other panes will not be exactly the same as the colour used on the ribbon: it will be slightly transparent over the background of the other panes.
Ribbon modes lists all the kinds of ribbon segments this indicator can produce. The ribbon indicator defines various modes and as each mode becomes active, BullCharts paints the ribbon in that colour and style and (if the segment becomes wide enough) draws the label on top. To edit the label, colour and style of a segment, select that segment from the “Ribbon Modes” list, then adjust the Label, Colour, and Style controls to the right.
Label allows you to edit the label of the ribbon segment selected in the “Ribbon Modes” list.
Colour allows you to edit the foreground colour of the pattern of the ribbon segment selected in the “Ribbon Modes” list. To edit the background colour, see “Background Colour” above.
Style allows you to choose a pattern for the selected ribbon segment in the “Ribbon Modes” list. The pattern will be drawn with the contents of the “Colour” control as the foreground colour, and the contents of the “Background Colour” control as the background colour. The previews in the Style list accurately reflect the result of combining each pattern with the current foreground and background colours.
Horizontal Lines
The Horizontal Lines tab allows you to add any number of lines at various places on the vertical axis. Each line can have its own colour, style, and thickness.
The Horizontal Lines tab is always visible.
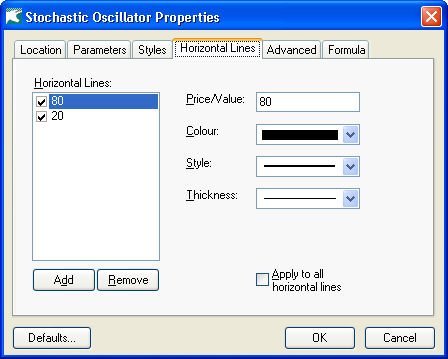
To add a horizontal line at a particular value on the vertical axis, type the value into the box next to the “Add” button, then click “Add”. The number should appear in the list below.
To remove an existing horizontal line at a particular value, select the value from the list next to the “Remove” button, then click “Remove”.
To style a horizontal line at a particular value, select the value from the list next to the “Remove” button, then adjust the settings displayed in the “Colour”, “Style” and “Line Thickness” lists.
To style all horizontal lines at the same time, select any line from the list then tick “Apply to all horizontal lines” and adjust the settings displayed in the “Colour”, “Style” and “Line Thickness” lists. When you have finished your adjustments, untick “Apply to all horizontal lines” again.
Advanced
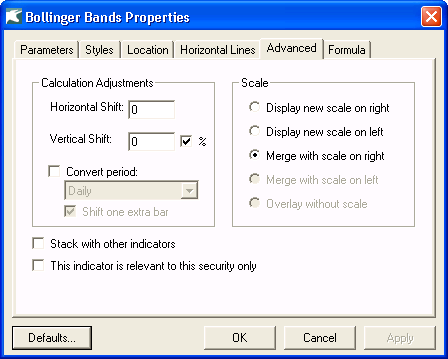
Calculation Adjustments provide a number of extra parameters that can be used to adjust any indicator. In earlier versions of BullCharts only some indicators had these options explicitly on the Parameters tab.
Horizontal Shift Allows you to shift the indicator or ribbon results left or right by the specified number of bars. A positive number will shift the indicator to the right, and a negative number will shift the indicator to the left.
Vertical Shift Adjusts the numerical result of the indicator. A positive number will increase the result, and a negative number will decrease the result. If the % checkbox is ticked, the increase is applied as a percentage added to the indicator result, otherwise the shift is applied as a simple addition or subtraction.
Shift one extra bar moves the data one extra bar, and is equivalent to increasing the horizontal shift by one. It is useful for enhancing the readability of a chart. When an indicator is using a converted period, the result for each period is displayed at the first bar of the period. However, to by shifting the result one extra bar, the result appears just to the right of the end of the period – making dates align more naturally.
Convert period can be used to change the period of the data before indicator is calculated. This option allows you to perform tasks such as displaying a weekly indicator on a daily chart. Internally BullCharts converts the data period by grouping bars together. Therefore the period can only be increase. (Ie it can not be used to display a daily indicator on a weekly chart.) If a period is selected that is smaller than the period of the current chart, then the option is ignored.
Scale The Scale options in the Advanced tab allows you to attach an indicator to the other vertical axis, attach it to a new vertical axis, or detach it from all vertical axes. The settings are exactly the same as the “Indicator Scale” options in the “Location” tab, described above. The Scale tab is only available for indicators after they have already been added to a chart.
Formula
The Formula tab allows you to view the BullScript formula that creates this indicator. This shows you exactly how a formula works, so you can decide whether it is reliable or just find out how to achieve similar results in your own formulas.
The Formula tab is always available.
If a formula is password protected, clicking on the Formula tab will prompt you for the password.