Overview
Line studies are technical analysis tools that consist of lines drawn on top of security prices or indicators. Line studies help you to analyse price movements, in order to identify possible opportunities.
Drawing tools are markers (other than lines) that can be placed on charts to mark events or interpret prices.
BullCharts provides a full range of line studies and drawing tools, which may be placed on any chart. Line studies available are:
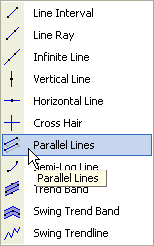
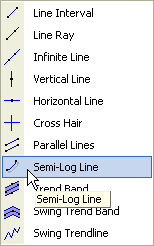
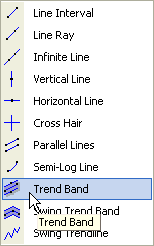
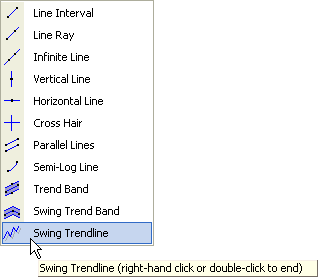
- Line Interval, Line Ray, Infinite Line, Vertical Line, Horizontal Line, Cross Hair, Parallel Lines, Semi-Log Line, Trend Band, Swing Trend Band, Swing Trendline
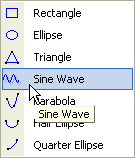
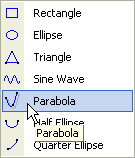
- Rectangle, Ellipse, Triangle, Sine Wave, Parabola, Half Ellipse, Quarter Ellipse
- Fibonacci Arcs, Fibonacci Fan, Fibonacci Retracement, Fibonacci Time Zones, Fibonacci Circles, Fibonacci Spiral, Fischer’s Ellipse
- Gann Fan, Gann Line, Gann Square, Gann Grid, Gann Retracement, Gann Angle
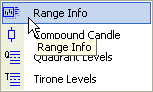
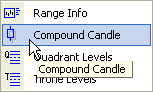
- Range Info, Compound Candle, Quadrant Levels, Tirone Levels
- Linear Regression, Raff Regression, Standard Deviation Channel, Standard Error Channel
- Time Ruler, Value Ruler, Percent Ruler, Trend Ruler
- Time Extension, Price Extension, Time Retracement, Price Retracement, Price Time Label, Time Series
- Cycle Lines, Single Cycle, Cycle Analysis
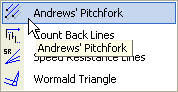
- Andrews’ Pitchfork, Count Back Lines, Speed Resistance, Wormald Triangle
- Icon Graphic Symbols, Trading Note Text Tool
Toolbar
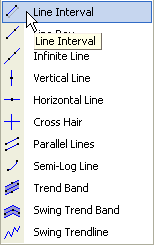
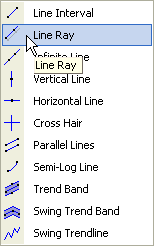
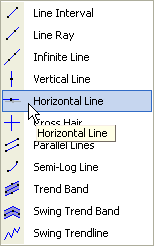
When any chart is open, the Line Studies toolbar is available at the left side of the page. To select any of the tools on the Line Studies toolbar, simply click the icon of the desired tool, or on the arrow to see an expanded view of all tools available in that toolbox.
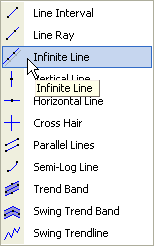
For example, the first icon on the toolbar is the Line Interval, but there are ten other line types that can be accessed by clicking on the arrow next to the icon.
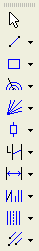
Other tools can be accessed using the ![]() arrows.
arrows.
See the end of this chapter for advanced line study techniques such as snap to data and overriding default settings.
Trendlines
Line Interval
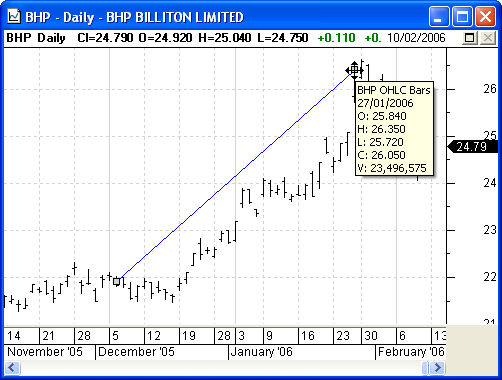
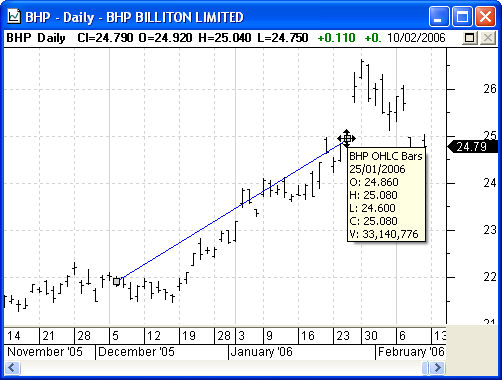
A line interval is the most basic of the line studies. It allows you to draw a line between two points on the chart. The purpose of the line interval is to track market direction by identifying trends in price movement.
Line intervals can help identify trading opportunities by highlighting trend breakouts. As the slope of the line allows you to visualise where the price is going, when the price starts to deviate from that direction, a reversal in the trend may occur. This could be a trading opportunity.
You may wish to draw several lines on the chart over different time periods to highlight a number of different trends.
Drawing a Line Interval
- Select the Line Interval tool
- To draw a line interval, select the Line Interval tool from the Line Studies toolbar at the left of the BullCharts window.
- Click and drag the mouse from the point at which the line should start, to the point at which it should finish. Release the mouse button, and the line will be anchored in place.
- Click and drag the mouse from the start point to the end point to draw the chart
Resizing and Repositioning Line Intervals
- Resizing and repositioning Line Intervals is useful when you want to change the size or direction of a line rather than drawing a whole new line.
- Resizing a line involves moving one end point only, so you can shorten the line, or change its angle. To resize a Line Interval, click and drag either the start or end points to a new location. The other end point will remain in its original position.
- To resize a Line Interval, click and drag either the start or end points to a new location.
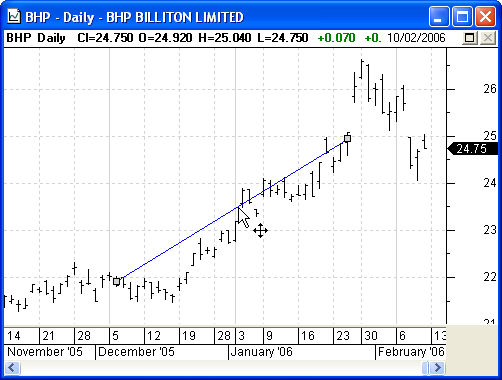
- To reposition a line interval, click and drag the line from somewhere along its length.
- Repositioning a line allows you to maintain the length and angle of a line interval, but simply change its position. To reposition a Line Interval, click the line somewhere along its length (not at the anchor points) and drag the line to the new location. This method can be used with all line studies and drawing tools.
Line Ray
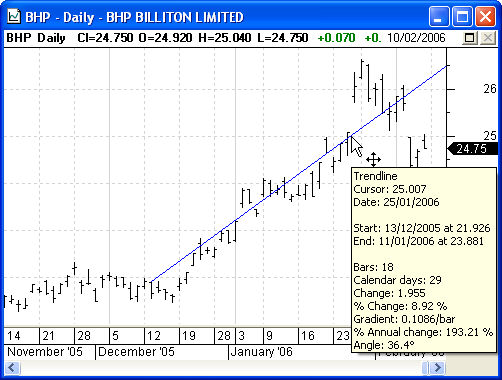
A line ray is very similar to a line interval, in that it is a straight line drawn between two points. The difference is that it extends to infinity in one direction. Like the line interval, the purpose of the line ray is to track market direction by identifying trends in price movement.
Drawing a Line Ray
- Select the Line Ray tool
- To draw a line ray, select the Line Ray tool from the Line Studies toolbar at the left of the BullCharts window.
- Click and drag the mouse from the point at which the line should start, to the point at which it should continue through. Release the mouse button, and the line will be anchored in place.
- Click and drag the mouse from the start point to the end point to draw the chart.
- Line Rays can be resized and repositioned in the same way used for the Line Interval.
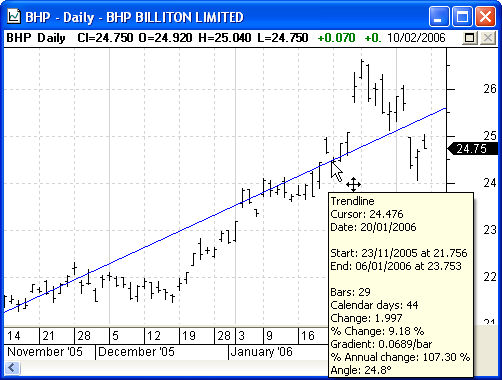
Infinite Line
An Infinite Line is also very similar to a line interval, in that it is a straight line drawn between two points. The difference is that it extends to infinity in both directions. Like the line interval and line ray, the purpose of the infinite line is to track market direction by identifying trends in price movement.
Drawing an Infinite Line
- Select the Infinite Line tool
- To draw an infinite line, select the Infinite Line tool from the Line Studies toolbar at the left of the BullCharts window.
- Click and drag the mouse from the start point to the end point to draw the chart.
- Click and drag the mouse from the point at which the line should start, to the point at which it should continue through. Release the mouse button, and the line will be anchored in place.
- Infinite Lines can be resized and repositioned in the same way used for the Line Interval and Line Ray.
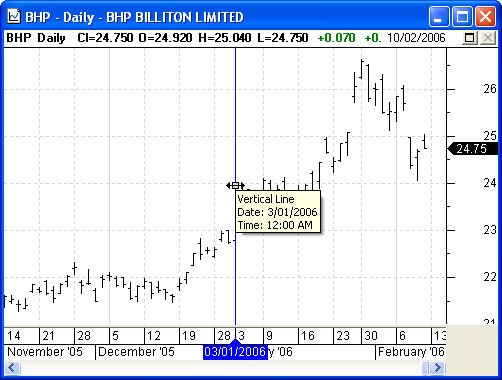
Vertical Line
The Vertical Line tool allows you to draw a vertical line on your chart in order to highlight significant points or events.
Drawing a Vertical Line
- Select the Vertical Line tool
- To draw a horizontal line, select the Vertical Line tool from the Line Studies toolbar at the left of the BullCharts window.
- Click the mouse where you wish the vertical line to be drawn.
- Click the mouse at the point on the chart that you wish the vertical line to be drawn. As the vertical line only requires one anchor point, the line will automatically be anchored in place.
- Vertical lines cannot be resized, as their length is infinite, and their angle is fixed. To reposition the line, click and drag the line left or right.
Horizontal Line
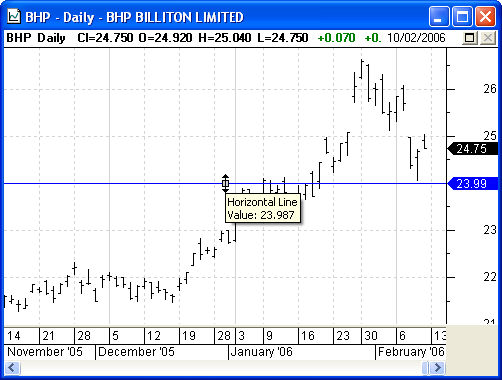
A Horizontal Line is a line study used to identify support and resistance levels as well as highlight trading ranges. Horizontal Lines can be applied to charts for securities whose price trades within a specific trading range. A Horizontal Line drawn at the bottom of the price range is the support line. A Horizontal Line drawn at the top of the price range is the resistance line. These Horizontal Lines highlight the range in which the security trades. If either of these lines is penetrated and the market continues in that same direction, this indicates that a price breakout may have taken place.
Drawing a Horizontal Line
- Select the Horizontal Line tool
- To draw a horizontal line, select the Horizontal Line tool from the Line Studies toolbar at the left of the BullCharts window.
- Click the mouse at the point on the chart that you wish the horizontal line to be drawn. As the horizontal line only requires one anchor point, the line will automatically be anchored in place.
- Click and drag the mouse from the start point to the end point to draw the chart.
- Horizontal lines cannot be resized, as their length is infinite, and their angle is fixed. To reposition the line, click and drag the line up or down.
Fixed Cross Hair
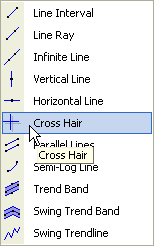
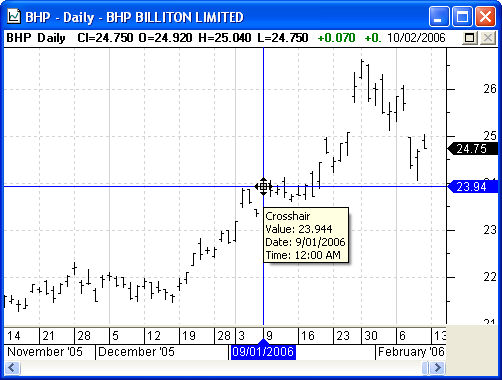
Use the fixed cross hair tool to drop a fixed cross hair onto the chart. The cross hair will display a tag in the price axis and the time axis to indicate its location. Placing a cross-hair is similar to placing both a horizontal and vertical line. Note: If you would like a cross-hair that constantly follows the mouse cursor, select “Crosshair” from the View menu instead.
Drawing a Fixed Cross Hair
- Select the Fixed Cross Hair tool
- To draw a fixed cross hair, select the Cross Hair tool from the Line Studies toolbar at the left of the BullCharts window.
- Click the mouse once at the point at the point on the chart that you would like the horizontal and vertical lines to intersect. You can subsequently relocate the cross-hair by dragging any part of it.
- Click and drag the mouse from the start point to the end point to draw the chart.
- By default, the vertical line of the cross hair will appear on every pane of the chart. This can be switched off by changing the Show on all panes option on the style tab of the cross hair properties window.
Parallel Lines
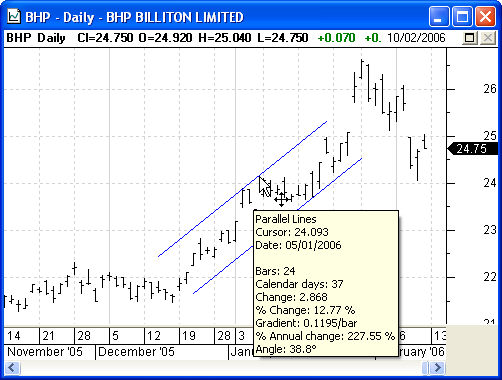
The parallel lines tool is used to draw two lines that are always parallel. This can be used to compare the gradient (steepness) of two trends, or it can be used to construct a channel around a trend.
Drawing a Parallel Line
- Select the Parallel Lines tool
- To draw a fixed cross hair, select the Cross Hair tool from the Line Studies toolbar at the left of the BullCharts window.
- Click once where you would like the first line to start, and a second time where you would like the first line to finish. (Alternatively, drag out this first line). A line will appear between the two points, and a second parallel line will appear nearby.
- Either line can now be dragged to a different location. If an end point of one line is moved, then the corresponding endpoint of the other line is also moved to ensure that the lines remain parallel.
- Click once to start the first line, and a second time to end the first line. A line will connect these points and a second line will appear near by.
Semi-Log Line
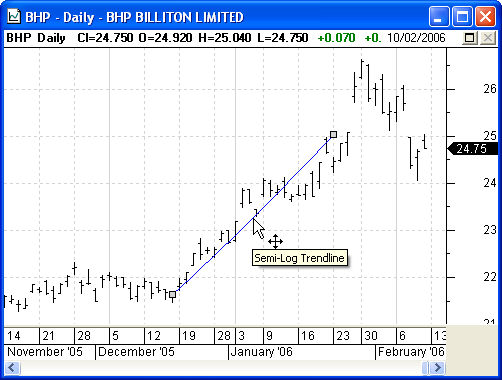
The semi-log line connects two points on a chart with a logarithmic curve. This is useful for identifying trends that have maintained a consistent percentage. Consider a security that has made consecutive peaks of 80 cents, 100 cents and 125 cents. These three points are non-linear and would not fit a normal trend line. However, both the second and third peek are 25% greater than the previous. The semi-log line would exactly fit against these three points.
The semi-log line appears as a line with a slight bow in it. The bow will typically be more noticeable when drawn across a greater price difference.
Note that the semi-log tool should not be used at the same time as the semi-log option of the price axis, as the effect would be applied twice.
Drawing a Semi-Log Line
- Select the Semi-Log Line tool
- The semi-log line is drawn in much the same way as a normal line tool. First select the Semi-Log Line option from the Line Studies toolbar at the left of the BullCharts window.
- Next there are two ways that it can be drawn. The first method is to click once where the line should start, then click a second time where the line should end. Alternatively, drag the mouse across the area where the line should be drawn.
- A semi-log trend line cannot be drawn on negative values. If an attempt is made to do this, then a normal straight line will be drawn in its place.
- Click once to start the semi-log line, and a second time to end it.
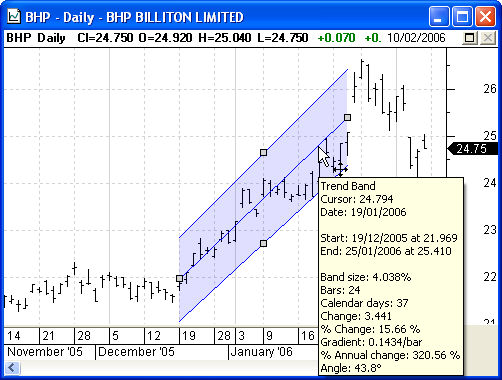
Trend Band
The trend band tool works in much the same way as the normal trend line, except there are additional lines drawn above and below the centre line. Use the trend band tool to highlight trading channels. The upper and lower lines can be either positioned a percentage distance from the centre line (the default), or a number of points from the centre line.
In percent mode, the start and end of each line are adjusted by a fixed percent. Because this is relative to the start and end of the centre lines, the size of the adjustment is different at each end. Therefore, when the trend band is in percent mode the lines are not parallel.
To change between percent mode and points mode, right click on the trend band and select properties. Then, on the parameters tab, adjust the drop-down next to band size. In percent mode, the band size represents percent. In points mode it is the number of points, or dollars. When you change from one mode to the other, you will almost always need to adjust the band size value, or your band may be too wide or narrow.
Drawing a Trend Band
- Select the Trend Band tool
- Start drawing the trend band in the same way as a normal line tool. First select the Trend-Band Line option from the Line Studies toolbar at the left of the BullCharts window.
- Next there are two ways that it can be drawn. The first method is to click once where the line should start, then click a second time where the line should end. Alternatively, drag the mouse across the area where the line should be drawn.
- When first drawn, the upper and lower lines will appear five percent away from the central line. There is a handle in the middle of each of these lines. Drag this handle to increase or decrease the width of the band. The opposite line will also move so that both lines are an equal distance from the centre line.
- Click once to start the trend band, and a second time to end it.
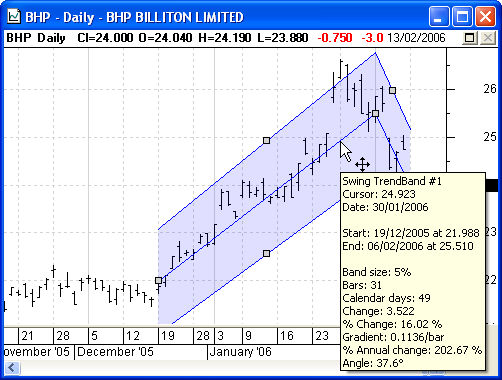
Swing Trend Band
The Swing Trend band is similar to the Swing Trendline however you are to adjust the band size either by percentage or points. This is very helpful to smooth the noise for a stock.
Drawing a Swing Trend Band
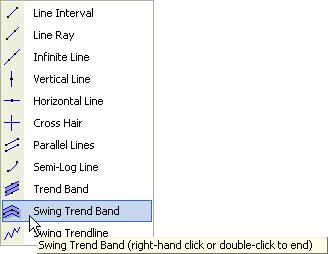
- Select the Swing Trend Band tool
- To apply, select the Swing Trend Band icon, then click on the chart for the first point, then click again for the next point and so on. The points will automatically be linked together. To end, simply press Esc on the keyboard or use the right hand mouse button. You are able to move the entire Swing Trend Band to compare a pattern on another part of the same chart as well as adjust the points. You are not able to add to the Swing Trend Band once it is created or copy to another chart.
- Click once to start the swing trend band, then click again for each additional point. The points will be automatically linked together. To end, simply press Esc on the keyboard or use the right hand mouse button.
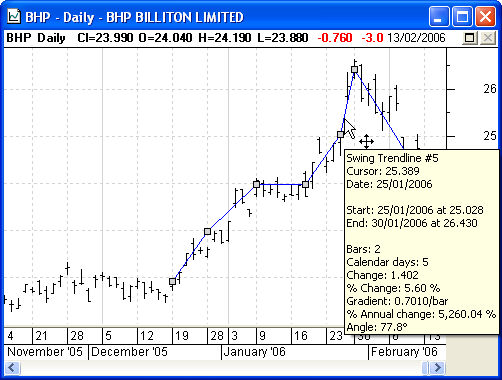
Swing Trendline
This tool allows you to manually create your own Swing line that is very useful in Elliot Wave analysis. You can select any number of points that are automatically joined together for convenience. You are able to then adjust the various points to other peaks and troughs as required.
- Drawing a Swing Trendline
- Select the Swing Trendline tool
- To apply, select the Swing Trendline icon, then click on the chart for the first point, then click again for the next point and so on. The points will automatically be linked together. To end, simply press Esc on the keyboard or use the right hand mouse button. You are able to move the entire Swing Trendline to compare a pattern on another part of the same chart as well as adjust the points. You are not able to add to the Swing Trendline once it is created or copy to another chart.
- Click once to start the swing trendline, then click again for each additional point. The points will be automatically linked together. To end, simply press Esc on the keyboard or use the right hand mouse button.
Geometric Tools
Rectangle
The Rectangle line study is used to highlight significant sections of a chart. For example, Rectangles can highlight what you believe to be up-trends or down-trends, or you can also use Rectangles together with analytical tools. Combining drawing tools such as a rectangle with analytical tools such as line studies and indicators helps you to gauge how well you are able to visually identify market phenomenon before testing your ideas with the analytical tools.
Drawing a Rectangle
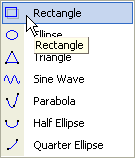
- Select the Rectangle tool
- To draw a rectangle, select the Rectangle tool from the Line Studies toolbar at the left of the BullCharts window.
- Click and drag the mouse from the point at which the rectangle should start, to the point at which it should finish. Release the mouse button, and the rectangle will be anchored in place.
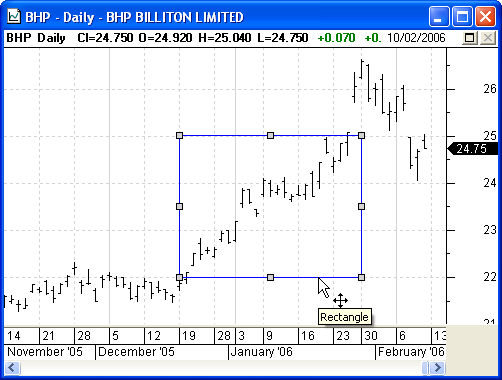
- Click and drag the mouse from the start point to the end point to draw the rectangle.
- Rectangles may be resized by clicking and dragging any of the eight anchor points. They may be repositioned by clicking any (non-anchor) point on the rectangle, and dragging it to a new position.
Ellipse
Like the rectangle, the Ellipse line study is used to highlight significant sections of a chart.
Drawing an Ellipse
- To draw an Ellipse, select the Ellipse tool from the Line Studies toolbar at the left of the BullCharts window.
- Select the Ellipse tool
- Click and drag the mouse from the point at which the Ellipse should start, to the point at which it should finish. Release the mouse button, and the ellipse will be anchored in place.
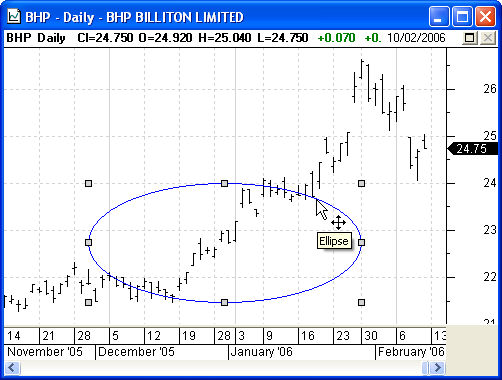
- Click and drag the mouse from the start point to the end point to draw the ellipse.
- Ellipses may be resized by clicking and dragging any of the eight anchor points. They may be repositioned by clicking any (non-anchor) point on the ellipse, and dragging it to a new position.
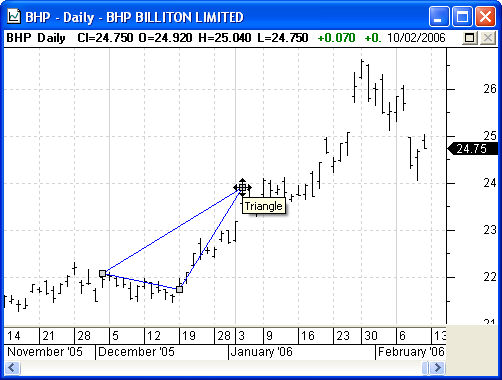
Triangle
Like the rectangle and ellipse, the triangle line study is used to highlight significant sections of a chart.
Drawing a Triangle
- Select the Triangle tool
- To draw a triangle, select the Triangle tool from the Line Studies toolbar at the left of the BullCharts window.
- Click the mouse at three points on the chart, the three anchor points of the triangle. As you click to mark an anchor point, a cross will appear to mark the point. Release the mouse button, and the ellipse will be anchored in place.
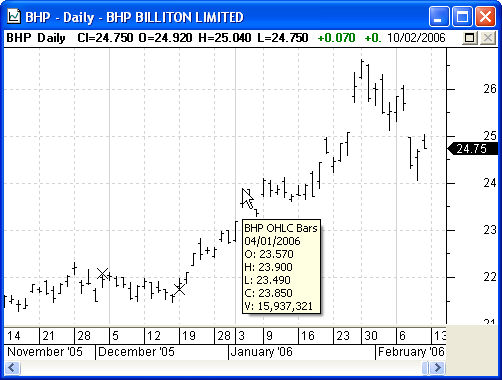
- Click your mouse on three points on the chart to draw a triangle between those three points.
- Triangles may be resized by clicking and dragging any of the three anchor points. They may be repositioned by clicking any (non-anchor) point on the triangle, and dragging it to a new position.
- Resize the triangle by clicking and dragging any of the anchor points.
Sine Wave
A Sine Wave is a line study that is used to identify cyclical price patterns. This method of analysis is based on the premise that a market’s price activity behaves in patterns. Once you identify a repeating price pattern, the sine wave assists in determining the time interval between each cycle.
Drawing a Sine Wave
- Select the Sine Wave tool
- To draw a sine wave, select the Sine Wave tool from the Line Studies toolbar at the left of the BullCharts window.
- Click and drag the mouse from a point at the top of a cycle, to the bottom of that cycle. Release the mouse button, and a repeating sine wave will be drawn based on that pattern
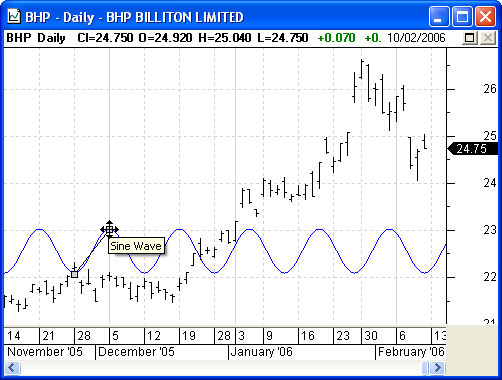
- Click and drag from the top to the bottom of a single cycle to draw the sine wave.
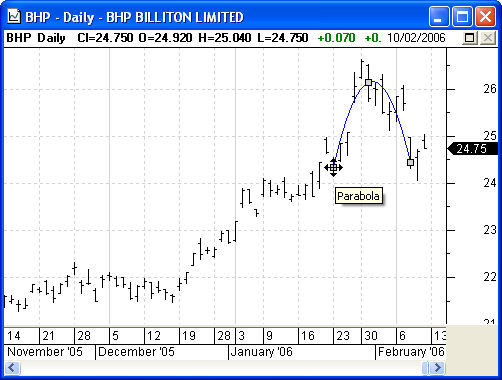
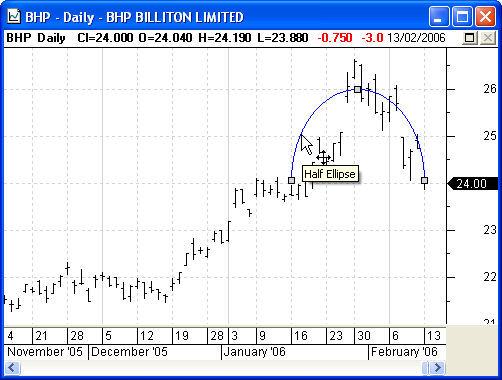
Parabola
A parabola is a curve that can be represented by the equation y = ax²+bx+c. It describes the path of an accelerating object (for example, the path of a ball being thrown). Some analysis methods use the parabola to analyse acceleration in a share price.
A parabola can be uniquely described with only three points. That is, given any three points, only one parabola will pass through all three of them.
Drawing a Parabola
- Select the Parabola tool
- To draw a parabola, select the Parabola tool from the Line Studies toolbar at the left of the BullCharts window. It is located in the same drop down as the other shape tools.
- Click on three different points on the chart. A cross will mark the location of the first two clicks. Once the third point is placed, a parabola will appear that passes through all three points. Once the parabola has been placed, it can be dragged around. Alternatively, the three handle points can be dragged around to change the shape of the parabola.
- Note: It is not possible to draw a parabola if any two of the points are drawn on the same date. If this is done then the parabola will be drawn as two straight lines.
- To draw a parabola, click on three places on the chart that the parabola should pass though.
Half Ellipse
Drawing a Half Ellipse
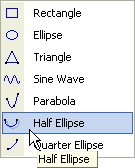
- Select the Half Ellipse tool
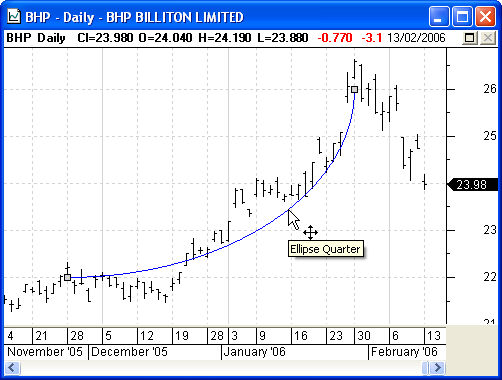
Quarter Ellipse
Drawing a Quarter Ellipse
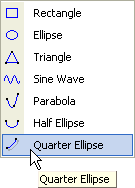
- Select the Quarter Ellipse tool
Fibonacci Tools
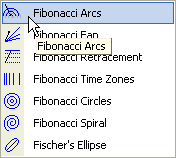
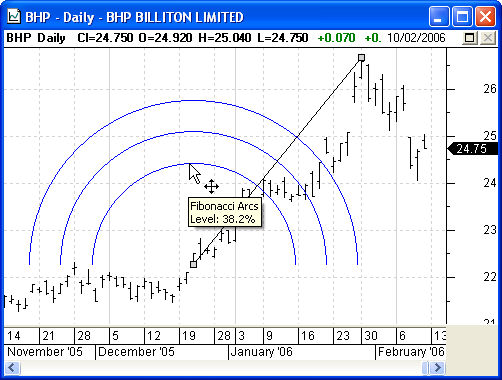
Fibonacci Arcs
Fibonacci Arcs are drawn by positioning a line between two extreme points (usually a trough and opposing peak). Centred on the second extreme point, three arcs are displayed. The arcs intersect the trend-line at 38.2%, 50.0%, and 61.8% – the Fibonacci levels.
The arcs are generally interpreted as lending support and resistance.
Drawing a Fibonacci Arc
- Select the Fibonacci Arc tool
- To draw a Fibonacci Arc, select the Fibonacci Arc tool from the Line Studies toolbar at the left of the BullCharts window.
- Click and drag from a trough to an opposing peak to draw a Fibonacci Arc.
- Click and drag the mouse from a trough to an opposing peak. Release the mouse button, and a Fibonacci arc will be drawn, centred on the peak.
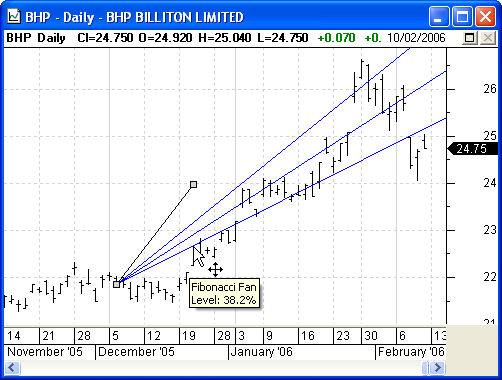
Fibonacci Fan
Fibonacci Arcs are drawn and interpreted in a similar manner to Fibonacci Arcs. They are drawn by positioning a line between two extreme points (usually a trough and opposing peak).
The lines (fans) drawn by the line study are also generally interpreted as lending support and resistance.
Drawing a Fibonacci Fan
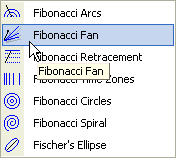
- Select the Fibonacci Fan tool
- To draw a Fibonacci Fan, select the Fibonacci Fan tool from the Line Studies toolbar at the left of the BullCharts window.
- Click and drag from a trough to an opposing peak to draw a Fibonacci Fan.
- Click and drag the mouse from a trough to an opposing peak. Release the mouse button, and a Fibonacci Fan will be drawn.
Fibonacci Retracement
Like the Arcs and Fans, Fibonacci Retracements are also used to indicate possible levels of support and resistance. They are drawn by positioning a line between two extreme points (usually a trough and opposing peak).
The retracement lines drawn by the line study are also generally interpreted as lending support and resistance.
The Fibonacci Retracement tool is a special instance of the Price Retracement tool. See the help notes on Price Retracement for more details.
Drawing a Fibonacci Retracement
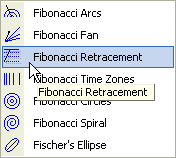
- Select the Fibonacci Retracement tool
- To draw a Fibonacci Retracement, select the Fibonacci Retracement tool from the Line Studies toolbar at the left of the BullCharts window.
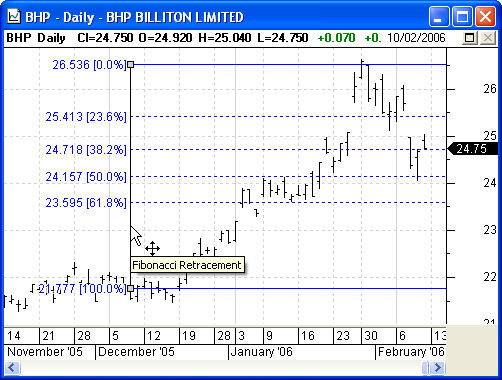
- Click and drag the mouse from a trough to an opposing peak. Release the mouse button, and a Fibonacci Retracement will be drawn.
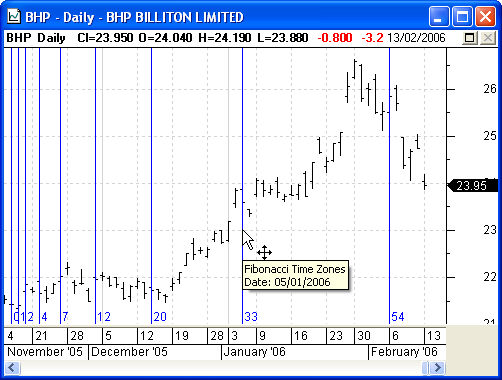
Fibonacci Time Zones
Drawing Fibonacci Time Zones
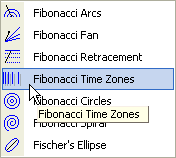
- Select the Fibonacci Time Zones tool
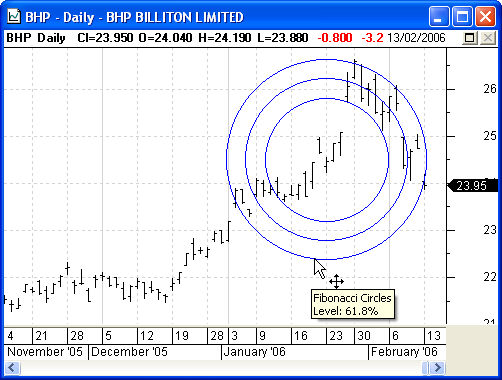
Fibonacci Circles
Drawing Fibonacci Circles
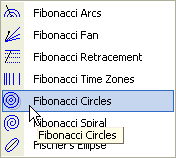
- Select the Fibonacci Circles tool
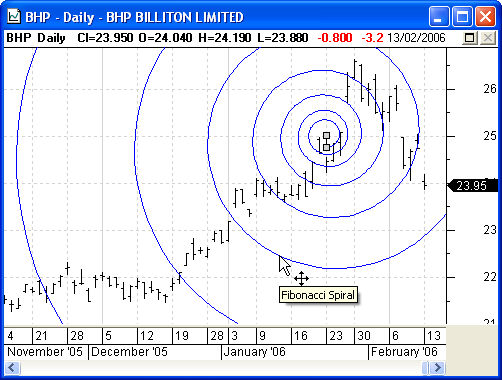
Fibonacci Spiral
Drawing a Fibonacci Spiral
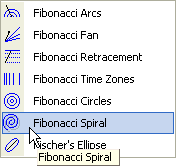
- Select the Fibonacci Spiral tool
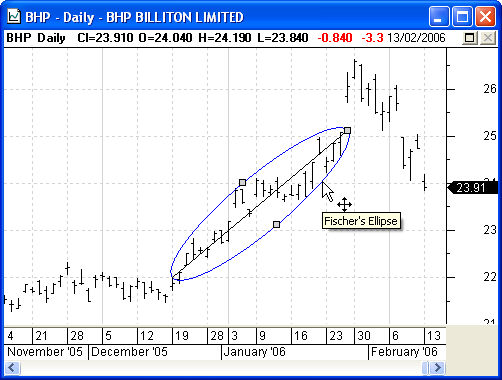
Fischer’s Ellipse
Drawing a Fischer’s Ellipse
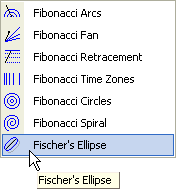
- Select the Fischer’s Ellipse tool
Gann Tools
Gann Fan
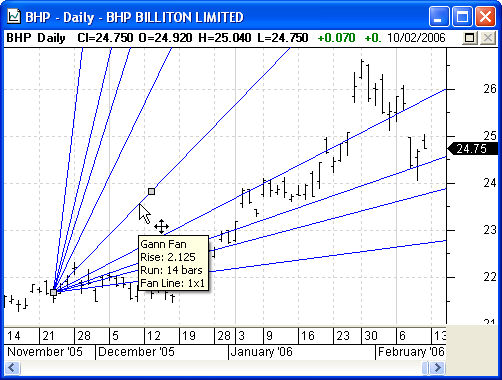
Gann Fans are used to identify price breakouts and the strength of those breakouts. The Gann Fan is drawn using a series of angled lines that ‘fan’ out from a single point. These lines are drawn at nine significant angles identified by W. D. Gann. Gann Fans are similar to trendlines, drawn from prominent market tops or bottoms at Gann’s special angles. They are therefore helpful in determining support and resistance levels.
Drawing a Gann Fan
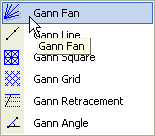
- Select the Gann Fan tool
- To draw a Gann Fan, select the Gann Fan tool from the Line Studies toolbar at the left of the BullCharts window.
- Click on any point on the chart to draw a Gann Fan originating from that point.
- Click on any point on the chart, and a Gann Fan originating from that point will be drawn.
- By default the Gann Fan uses ratios 1×8, 1×4, 1×3, 1×2, 1×1, 2×1, 3×1, 4×1 and 8×1. It is possible to edit this list of ratios, or apply colouring to each individual line. Select the Fan Lines tab in the Gann properties to access the ratio editor.
Gann Line
Gann Lines are used to identify price breakouts and the strength of those breakouts. The Gann Line is drawn at a specific angle, fanning out from a single point. This line is drawn at the significant angle of 45 degrees identified by W. D. Gann. A Gann Line is similar to a trendline, drawn from prominent market tops or bottoms. They are therefore helpful in determining support and resistance levels.
Drawing a Gann Line
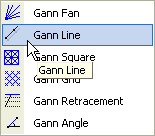
- Select the Gann Line tool
- To draw a Gann Line, select the Gann Line tool from the Line Studies toolbar at the left of the BullCharts window.
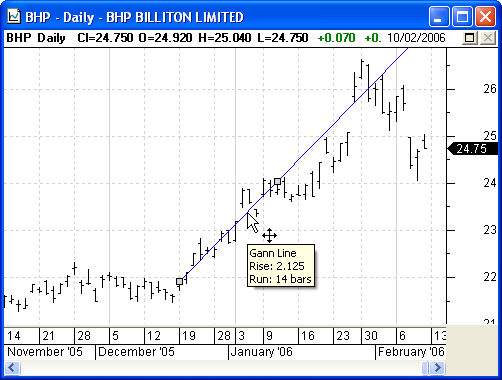
- Click on any point on the chart to draw a Gann Line originating from that point.
- Click on any point on the chart, and a Gann Line originating from that point will be drawn.
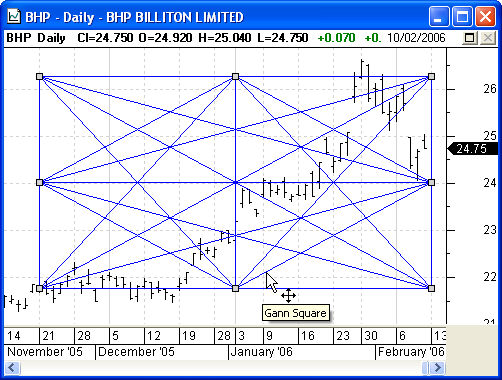
Gann Square
Gann squares are a construction developed by W. D. Gann. Refer to his literature for a detailed discussion of its interpretation.
Drawing a Gann Square
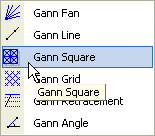
- Select the Gann Square tool
- The Gann Square is drawn in much the same way as the rectangle tool. To draw the Gann Square, select the Gann Square tool from the Line Studies toolbar at the left of the BullCharts window. It is located in the same menu as the other Gann tools.
- Click and drag the mouse from the point at which the Gann Square should start, to the point at which it should finish. Release the mouse button, and the Gann Square will be anchored in place.
- Click and drag the mouse from the start point to the end point to draw the rectangle.
- The Gann Square can be resized by clicking and dragging any of the eight anchor points. They may be repositioned by clicking any (non-anchor) point on the rectangle, and dragging it to a new position.
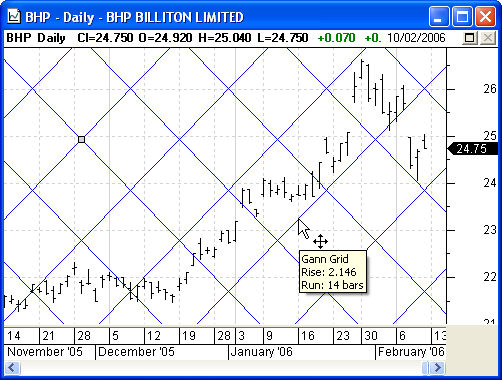
Gann Grid
Gann Grids draw a grid based on Gann Angles. They are therefore helpful in determining support and resistance levels.
Drawing a Gann Grid
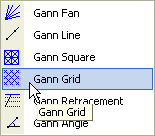
- Select the Gann Grid tool
- To draw a Gann Grid, select the Gann Grid tool from the Line Studies toolbar at the left of the BullCharts window.
- Click on any point on the chart, and a Gann Grid originating from that point will be drawn.
- Click on any point on the chart to draw a Gann Grid originating from that point.
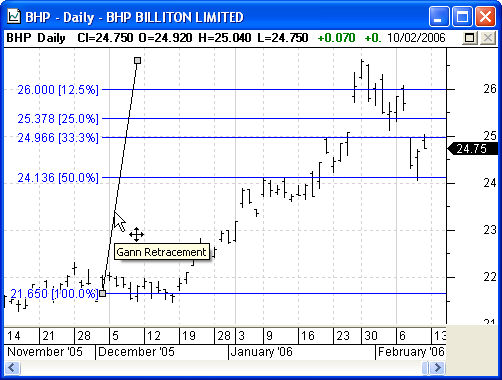
Gann Retracement
The Gann Retracement tool constructs a set of horizontal lines at different percentage levels. The percentage levels used are based on Gann’s whole-number ratios. 4×1, 3×1, 2×1, 1×1, 1×2, 1×3, 1×4.
The retracement lines drawn by the line study are also generally interpreted as lending support and resistance.
The Gann Retracement tool is a special instance of the Price Retracement tool. See the help notes on Price Retracement for more details.
Drawing a Gann Retracement
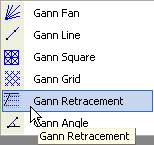
- Select the Gann Retracement tool
- To draw a Gann Retracement, select the Gann Retracement tool from the Line Studies toolbar at the left of the BullCharts window.
- Click and drag the mouse from a trough to an opposing peak. Release the mouse button, and a Gann Retracement will be drawn.
- Click and drag the mouse from a trough to an opposing peak. Release the mouse button, and a Gann Retracement will be drawn.
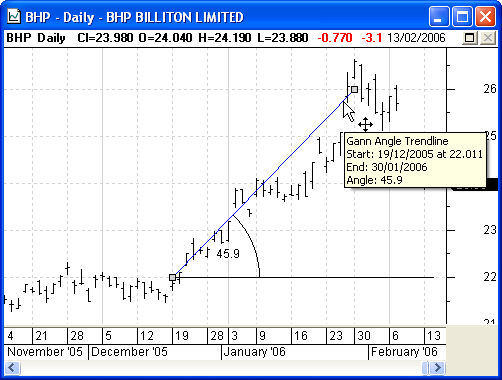
Gann Angle
Drawing a Gann Angle
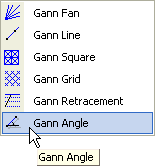
- Select the Gann Angle tool
Data Range Tools
Range Info
The Range Info tool displays basic statistical information about the data between two dates. This includes: the highest high, lowest low, total volume traded, number of bars, average closing price, number of calendar days, number of bars that have closed higher and lower.
Drawing a Range Info Box
- Select the Range Info tool
- To draw a Range Info box, select the Range Info tool from the Line Studies toolbar at the left of the BullCharts window.
- Drag the mouse on the price pane, from the required starting date to the end date. The dates can be fine-tuned in the property window for the range info tool. Note that the top and bottom of the rectangle will automatically adjust to exactly contain the highest and lowest point in the range.
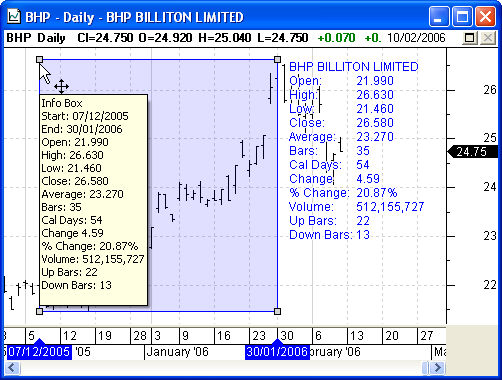
- Drag the Range Info box from the start date to the end date. The top and bottom of the box will adjust to contain the data being represented.
Compound Candle
The compound candle combines several individual candles into a single candle.
A candle is normally constructed as follows: The stick of the candle is drawn from the high price to the low price. The body of the candle is drawn from the open price to the close price. If the bar closes higher than the open than the body is empty, otherwise the body is filled.
The compound candle is constructed as follows: The stick of the candle is drawn from the highest high in the range to the lowest low in the range. The body of the candle is drawn from the open price of the first bar in the range to the close of the last bar in the range. If the last close is higher than the first open then the compound candle is empty, otherwise it has a translucent fill.
Drawing a Range Info Box
- Select the Compound Candle tool
- To draw a Compound Candle, select the Compound Candle tool from the Line Studies toolbar at the left of the BullCharts window.
- Drag the mouse on the price pane, from the required starting date to the end date. The dates can be fine-tuned in the property window for the range info tool. As the mouse is dragged along, the candle will automatically adjust the size of the candle stick and body.
- Note that the candle will jump around substantially while it is being dragged. This is normal, and is because the price values it is anchored on are changed.
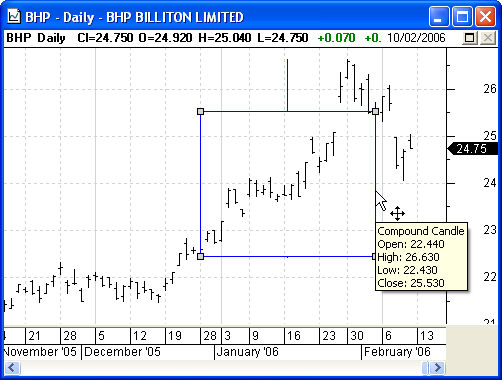
- Drag the Compound Candle from the start date to the end date. The stick and body will automatically adjust as it is being dragged.
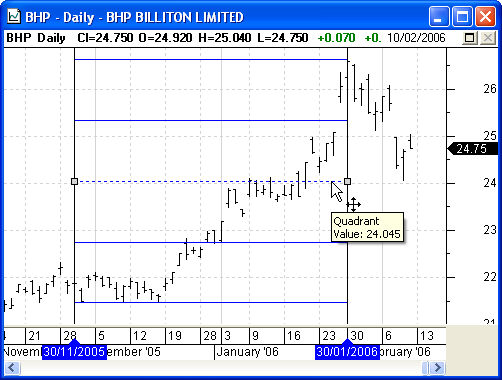
Quadrant Levels
Quadrant lines divide the high and low values into four equal sections. These lines are drawn horizontally, with the median (middle) price shown as a dotted line.
Drawing a Quadrant
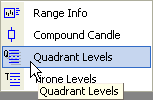
- Select the Quadrant tool
- To draw a Quadrant, select the Quadrant tool from the Line Studies toolbar at the left of the BullCharts window.
- Click and drag your mouse over the time period that the quadrant should cover.
- Click and drag your mouse from left to right, spanning the time period you wish the quadrant to cover. A Quadrant will be drawn, covering the high/low range for that time period.
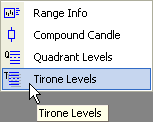
Tirone Levels
Tirone Levels divide the high and low values into sections, which help identify support and resistance levels. These lines are drawn horizontally, are can be constructed using one of two methods.
Midpoint Method gives three levels. The top level is calculated by subtracting the lowest low of the period from the highest high, then dividing the result by three, and subtracting this result from the highest high value.
The bottom level is calculated by subtracting the lowest low of the period from the highest high, dividing this value by three, then adding this result to the lowest low value.
The middle level is calculated by subtracting the lowest low value for the period from the highest high, dividing this value by two, then adding this result to the lowest low value.
Mean Method gives five levels. The middle level is calculated by adding the highest high value and the lowest low value for the period to the last closing price for the period, then dividing the result by three.
The Extreme High level is calculated by subtracting the lowest low value from the highest high value for the period, then adding this value to the middle level.
The Regular High level is calculated by subtracting the lowest low value from the middle level multiplied by two.
The Extreme Low level is calculated by subtracting the lowest low value for the period from the highest high, then subtracting this result from the middle level.
The Regular Low level is calculated by subtracting the highest high value for the period from the middle level multiplied by two.
Drawing a Tirone
- Select the Tirone tool
- To draw Tirone Levels, select the Tirone tool from the Line Studies toolbar at the left of the BullCharts window.
- Click and drag your mouse from left to right, spanning the time period you wish the Tirone levels to cover. The Tirone levels will be drawn over that time period.
- Click and drag your mouse over the time period that the Tirone Levels should cover.
Regression Tools
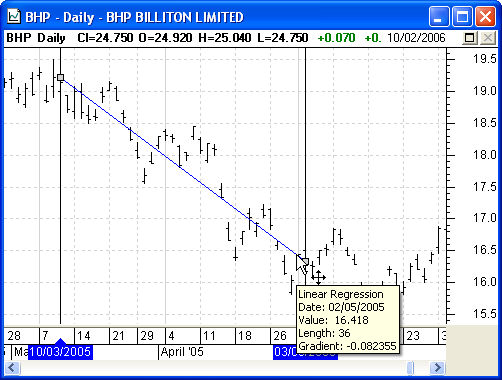
Linear Regression
A Linear Regression line statistically predicts future trading prices. It bases these predictions on trading data over the period covered by the line. The Linear Regression line can be thought of as an “average’ price, where prices above this line suggest overbuying, and prices below overselling.
Drawing a Linear Regression Line
- Select the Linear Regression tool
- To draw a Linear Regression Line, select the Linear Regression tool from the Line Studies toolbar at the left of the BullCharts window.
- Click and drag your mouse from left to right, spanning the time period you wish to cover. A Linear Regression line will be drawn over this time range.
- Click and drag your mouse over the time period that the Linear Regression should cover.
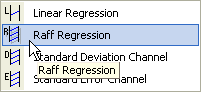
Raff Regression
A Raff Regression is a set of three lines. The middle line is simply a Linear Regression Line, and the other two are parallel to this middle line, positioned equidistant above and below. The distance between the top and bottom lines and the linear regression line is equal to the greatest distance between any closing price and the linear regression line. The top and bottom lines are helpful in determining support and resistance.
Drawing a Raff Regression
- Select the Raff Regression tool
- To draw a Raff Regression, select the Raff Regression tool from the Line Studies toolbar at the left of the BullCharts window.
- Click and drag your mouse from left to right, spanning the time period you wish to cover. A Raff Regression will be drawn over this time range.
- Click and drag your mouse over the time period that the Raff Regression should cover.
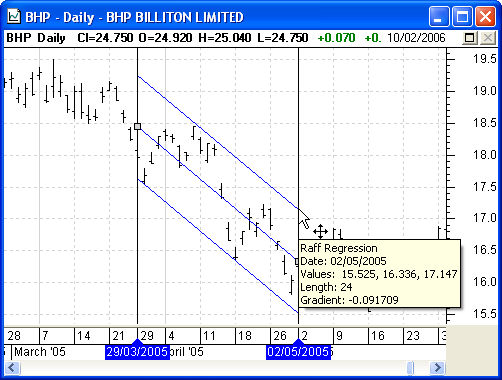
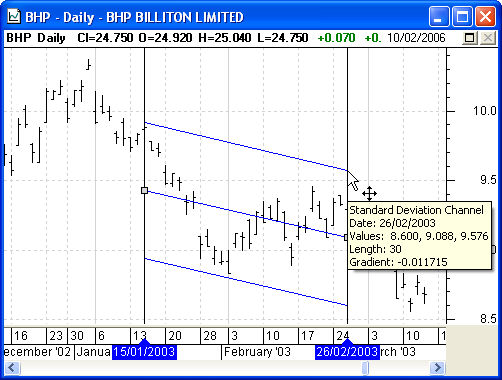
Standard Deviation Channel
A Standard Deviation Channel is also a set of three lines. The middle line is also a Linear Regression Line, and the other two are parallel to this middle line, positioned equidistant above and below. By default, the top and bottom lines are positioned 2 standard deviations away from the linear regression line. The top and bottom lines are helpful in determining support and resistance levels.
Drawing a Standard Deviation Channel
- Select the Standard Deviation Channel tool
- To draw a Standard Deviation Channel, select the Standard Deviation Channel tool from the Line Studies toolbar at the left of the BullCharts window.
- Click and drag your mouse from left to right, spanning the time period you wish to cover. A Standard Deviation Channel will be drawn over this time range.
- Click and drag your mouse over the time period that the Standard Deviation should cover.
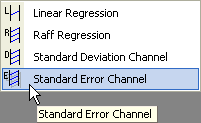
Standard Error Channel
A Standard Error Channel is also a set of three lines. The middle line is also a Linear Regression Line, and the other two are parallel to this middle line, positioned equidistant above and below. By default, the top and bottom lines are positioned 2 standard errors away from the linear regression line. The top and bottom lines are helpful in determining support and resistance levels.
Drawing a Standard Error Channel
- Select the Standard Error Channel tool
- To draw a Standard Error Channel, select the Standard Error Channel tool from the Line Studies toolbar at the left of the BullCharts window.
- Click and drag your mouse from left to right, spanning the time period you wish to cover. A Standard Error Channel will be drawn over this time range.
- Click and drag your mouse over the time period that the Standard Error Channel should cover.
Rulers
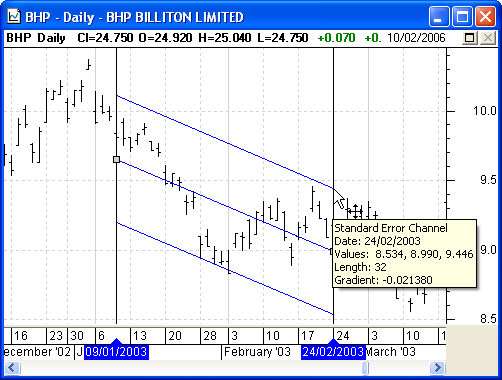
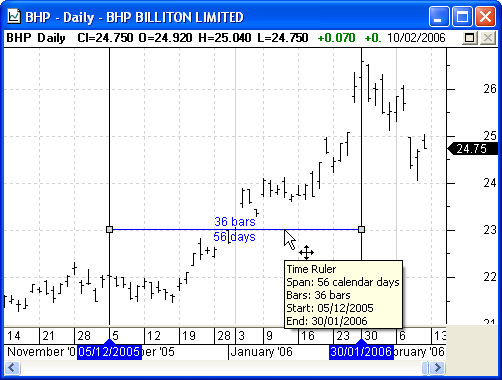
Time Ruler
The Time Ruler tool allows you to easily measure the period of time between two points on a chart.
Drawing a Time Ruler
- Select the Time Ruler tool
- To draw a Time Ruler, select the Time Ruler tool from the Line Studies toolbar at the left of the BullCharts window.
- Click and drag your mouse from left to right, spanning the time period you wish to measure. A time ruler will be drawn over this time range.
- Click and drag your mouse over the time period that the time ruler should cover.

- Time Ruler Properties
- To access the properties for the time ruler, right click on it and select Properties. From the properties page you can explicitly set the start and end dates. Alternatively, you can enter the required length of the ruler into the “Bars” property. Modifying the bars property will adjust end date to make the ruler the correct length (unless you just explicitly set the end date, in which case the start date will be modified).
Value Ruler
The Value Ruler tool allows you to easily measure the price movement between two points on a chart.
Drawing a Value Ruler
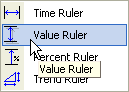
- Select the Value Ruler tool
- To draw a Value Ruler, select the Value Ruler tool from the Line Studies toolbar at the left of the BullCharts window.
- Click and drag your mouse from top to bottom, spanning the price range you wish to measure. A value ruler will be drawn over this price range.

- Click and drag your mouse over the price range that the value ruler should cover.
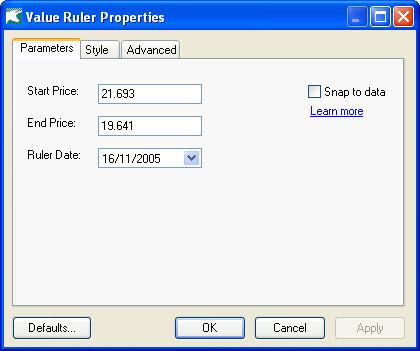
- Value Ruler Properties
- To access the properties for the value ruler, right click on it and select Properties. From the properties page you can explicitly set ruler date. Alternatively, you can specify the start and end prices.
Percent Ruler
The Percent Ruler tool allows you to easily measure the price movement in percentage terms between two points on a chart.
Drawing a Percent Ruler
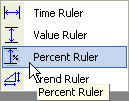
- Select the Percent Ruler tool
- To draw a Percent Ruler, select the Percent Ruler tool from the Line Studies toolbar at the left of the BullCharts window.
- Click and drag your mouse from top to bottom or bottom to top, spanning the price range you wish to measure. A percent ruler will be drawn over this price range.
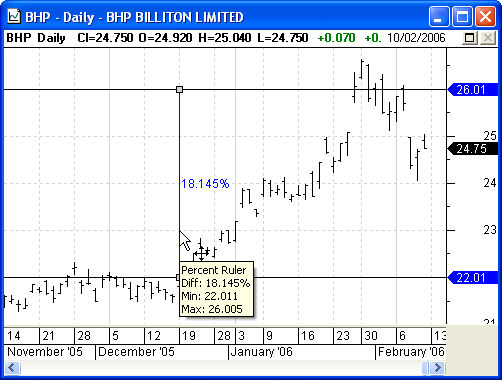
- Click and drag your mouse over the price range that the percent ruler should cover.
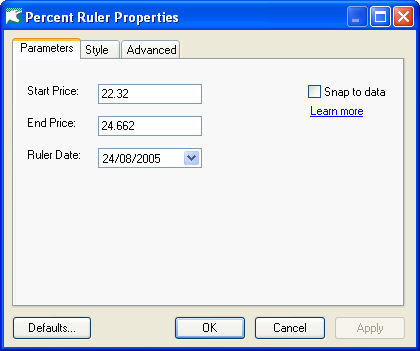
- Percent Ruler Properties
- To access the properties for the percent ruler, right click on it and select Properties. From the properties page you can explicitly set ruler date. Alternatively, you can specify the start and end prices.
Trend Ruler
The Time Ruler tool is a combination of the Time Ruler, Value Ruler and Percent Ruler that allows you to easily measure the period of time between two points on a chart in addition to the amount on change between these two points.
Drawing a Trend Ruler
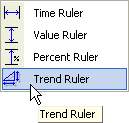
- Select the Trend Ruler tool
- To draw a trend ruler, select the Trend Ruler tool from the Line Studies toolbar at the left of the BullCharts window.
- Click and drag the mouse from the point at which the trend ruler should start, to the point at which it should finish. Release the mouse button, and the trend ruler will be anchored in place.
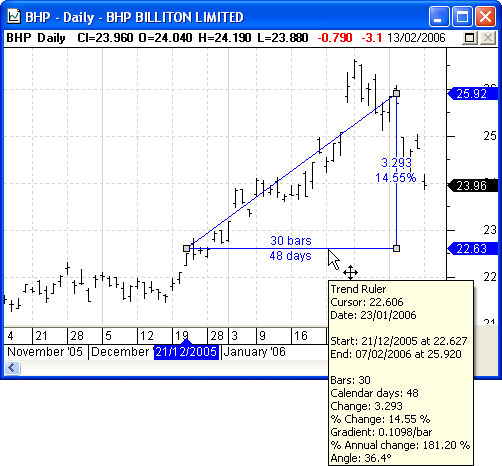
- Click and drag your mouse between the two points that the trend ruler should measure.

- Trend Ruler Properties
- To access the properties for the trend ruler, right click on it and select Properties. From the properties page you can explicitly set the start date, end date, start price and end price.
Miscellaneous
Andrews’ Pitchfork
The Andrews’ Pitchfork tool is a series of three trendlines. They help in determining support and resistance levels.
Drawing an Andrews’ Pitchfork
- To draw an Andrews’ Pitchfork, select the Andrews’ Pitchforktool from the Line Studies toolbar at the left of the BullCharts window.
- Click on a start point (typically an early extreme low), then click on a second point (typically a later high), then click on a third point (typically an even later low) to draw an Andrews’ Pitchfork through these three points.
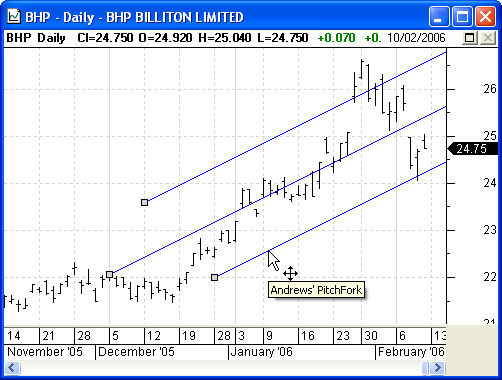
- Click three points on the chart in order to draw an Andrews’ pitchfork through those points.
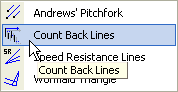
Count Back Lines
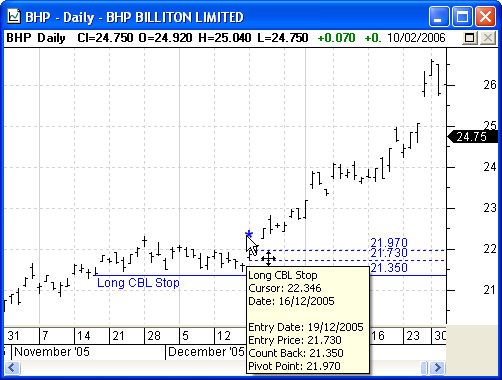
Count back lines are strategy discussed in Daryl Guppy’s books. The count back line is used to determine an appropriate stop-loss level. Several can also be used together to determine an entry point. The count back level is determined by counting a certain number of higher highs or lower lows back from the starting point.
When the count back line tool is placed, it will automatically create a short line or a long line depending on which one would have been generated first.
Drawing Count Back Lines
- Select the Count Back Lines tool
- To draw Count Back Lines, select the Count Back Lines tool from the Line Studies toolbar at the left of the BullCharts window.
- Press the left mouse button down at the bar that is to be the starting point, then drag the mouse to the right to extend the lines out. The dashed line represents the starting price, and the solid line represents the count back level.
- The count back level will be either above or below the entry level depending on which of the two possible count-back lines was defined first (most recently in the chart’s history). Apart from the Entry and Count back line, a Pivot line is also provided as shown by “*” and the relevant dotted line.
Speed Resistance Lines
The Speed Resistance Lines tool is a series of three trendlines.
Drawing Speed Resistance Lines
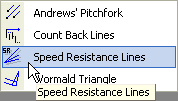
- Select the Speed Resistance Lines tool
- To draw Speed Resistance Lines, select the Speed Resistance Linestool from the Line Studies toolbar at the left of the BullCharts window.
- Click and drag the mouse from a start point (typically an extreme low) to an end point (typically an extreme high) to draw Speed Resistance Lines.
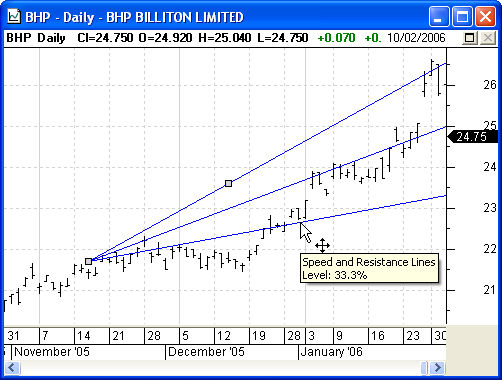
Click and drag the mouse from a start point to an end point to draw Speed Resistance Lines.
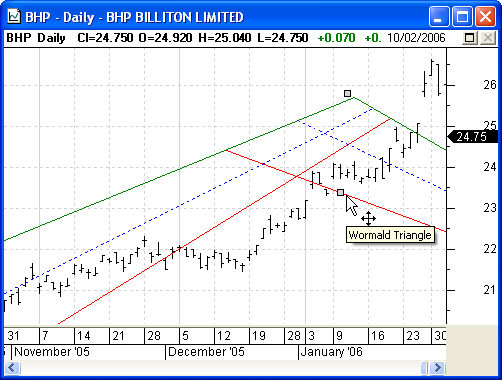
Wormald Triangle
Wormald identified that triangular patterns often occur in price data, and that the angle formed is often at a fixed value. Consult Wormald’s literature for a more detailed discussion of how to apply the Wormald Triangle.
Drawing Wormald Triangles
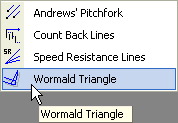
- Select the Wormald Triangle tool
- To draw Wormald Triangle Lines, select the Wormald Triangle tool from the Line Studies toolbar at the left of the BullCharts window.
- Click once at the start of a trend, on the trough. A cross will appear. Click a second time on the following peak, and then a third time at the next trough. A Wormald triangle will be constructed through these three points.
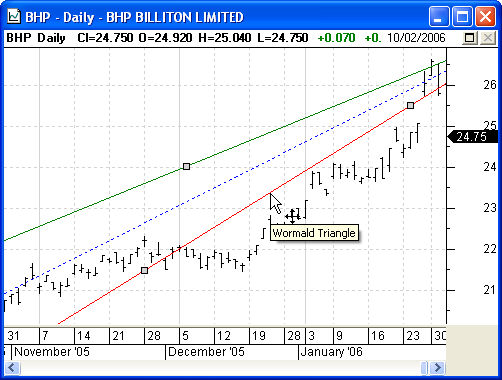
- The first Wormald triangle, drawn by clicking three times.
- Wormald often presented a series of triangles that overlapped into each other. When you draw more than one Wormald triangle, an intersection is automatically determined and the triangles are cropped accordingly.
- Two or more Wormald triangles will automatically intersect and crop.
- The cropping behaviour can be disabled in the properties for the Wormald triangle. Turn off the Interact with other Wormald Triangles option. The triangle will no longer crop, and will no longer cause other triangles to be cropped.
Icon Tool
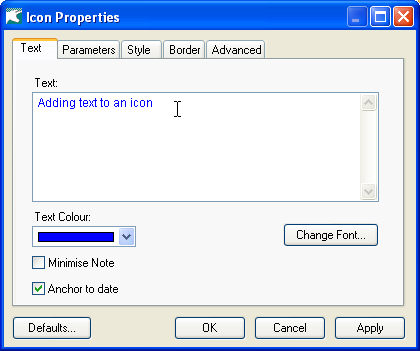
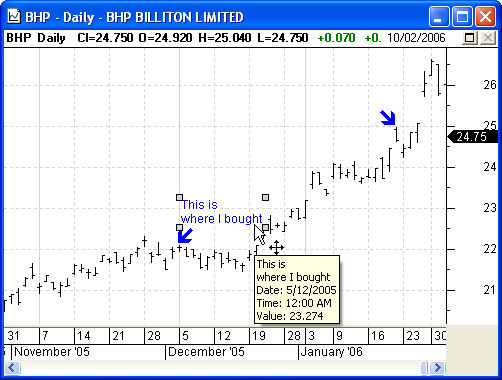
The icon tool allows you to place icons on your charts in order to identify significant events such as turning points or times you bought or sold securities. The properties of the icon allow you to add text.
Drawing an Icon

- Select the Icon tool
- To draw an icon, select the Icon tool from the Line Studiestoolbar at the left of the BullCharts window.
- Click on the icon that you wish you use from the Icon Palette.
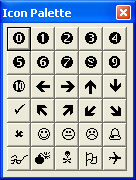
- Click the icon you wish to use.
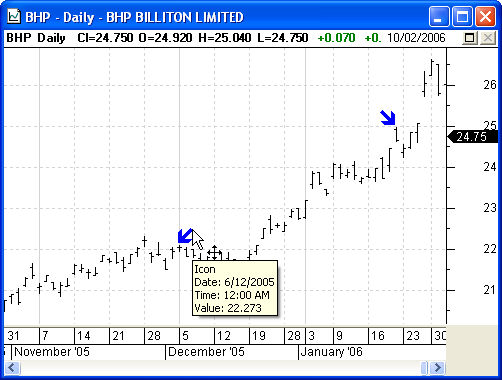
- Click the place on the chart that you wish the icon to appear.
- To draw the icon, simply click the place on the chart that you wish the icon to appear. It will be drawn in that location.
Note Tool
The Note or text tool allows you to draw text on your charts, to make note of your thoughts or significant events on the chart.
Adding a Note

- Select the Note tool
- To draw a note, select the Note tool from the Line Studiestoolbar at the left of the BullCharts window.
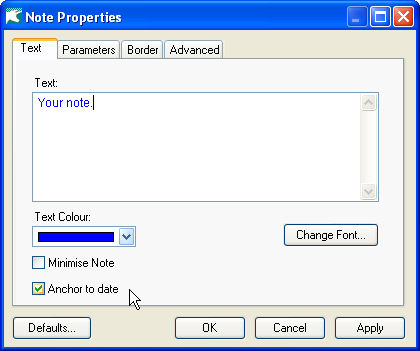
- Type the note in the text box.
- Click the mouse at the point that you wish the text to start from, and then type the note that you wish to place.
- Click on the chart in the position you wish the text to appear.
- Minimise Note allows you to hide the text of the note and display only an icon. When you hover over the icon the text will display as a tooltip.
- Anchor to date when selected will link the note to a particular date. When you scroll through the chart the note will stay linked to the date. Useful when attach trading notes to a date. However, sometimes you may wish a note to stay fixed to an area of the screen independent of date. Hence it will not move when you scroll the chart.
Snap to Data
It is a common task to draw trendlines or other line studies from critical price points such as peaks and troughs. BullCharts supports a snap to data feature that assists you in exactly placing line studies on the chart. There are two different ways that you can use the snap to data feature. Either set a tool up so that it always snaps to price as it is moved around, or use a hot key while dragging the tool to snap just for that moment.
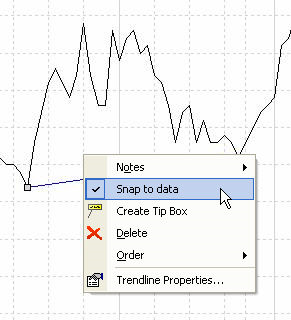
Snap to Data Option
Right click on a line study tool and select snap to data. It will move to the data plot. If you drag the line left and right then it will stay locked to the data.
Snap to Data Hot Keys
Often you will want more precise control over how the tool snaps to data. For example, you may want one end to snap to the low price, and the other end to snap to the high price. Alternatively, you may only want to snap one end of a tool. To achieve this, do not turn on the snap to data option, but use the snap hot keys instead.
First select the tools that you want to draw, such as a retracement. Then hold down the letter “L”. Start drawing the tool. The first point will snap to the low price. As you drag the mouse, the second point will continue to follow the low price. Release the “L” key. The second point now freely follows the mouse. Hold down the “H” key. The second point now snaps to the high price. Release the mouse. Then release the “H” key.
The snap hot keys are as follows: O=open price, H=high price, L=low price, C=close (or last) price. V=volume (on the volume pane). S=snap to anything (useful for indicators).
If you hold down a hot key while you are dragging a handle, only that handle will be snapped. If you hold down a hot key while you are dragging the entire line study, then all applicable handles will snap similar to if the snap to data option was ticked.
Remember: Once the hot key is released, the line will start following the mouse again, so practice releasing the mouse button to complete the change before releasing the hot key.
Default Settings
Each of the line study tools have a number of options that can be configured, such as the style of the line, whether or not labels are shown, whether or not lines are extended, and many more. Every time you draw a new instance of that tool, certain default settings will be applied. It is possible to change what these default settings are on a per-tool basis.
The defaults can be changed for most general properties. But they cannot be set for any properties that are specific each instance of the line study. For example, the default start-date of a trend line cannot be set, because the start-date of a trendline depends on where it is drawn.
Changing the default settings
Draw a tool that you wish to adjust the default settings for. For example, a trend band. Right click the trend band and select properties. Adjust the settings to how you would prefer. For example, change the colour to red, reduce the band size to 2%, and change the fill to transparent.
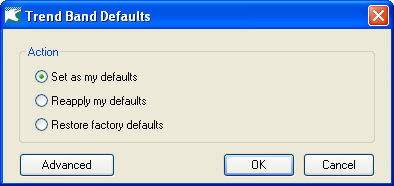
Next click the Defaults button at the bottom left of the window. The Trend Band Defaults window will appear. Select “Save these settings as my defaults” and press OK. From now on, whenever a trend band tool is drawn, it will initially have a colour of red, a 2% band size, and will have no fill.
Reapplying Defaults
If you make further changes to a line study tool, you can restore it to the current defaults, you can restore it to the current defaults (i.e. what it looked like when it was first drawn) by going to the properties, pressing the defaults button then selecting “Reapply my defaults”. Then press OK. This changes any settings back to the state they were in when the line was first drawn.
Restoring Factory Defaults
If you have saves your own settings as defaults, it is possible to return to the factory defaults built into BullCharts. Go to the properties for the tool in question, and select “Restore factory defaults”, and press OK. This will reset the properties for the current tool, and it will reset the defaults for whenever that tool is drawn in the future.
Setting Individual Properties
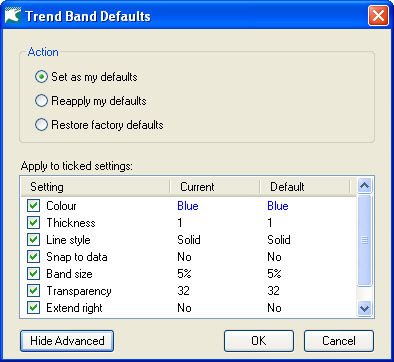
The above three paragraphs described how to set or reset all of the properties for a tool, but it is also possible to apply changes to only some properties. From the Defaults window, press the Advanced button.
The window will expand and list all of the properties for the current tool that can have their defaults set. The column titled “Current” shows what the setting currently is in the properties box at the moment. The column titled “Default” shows what your default value currently is (not the factory default).
For each of the three tasks (save, reapply, restore factory), only the properties that are ticked will be affected.
This is also a useful way to learn which properties can and cannot have default values set.