IntelliCharts Overview
IntelliCharts are a BullCharts technology designed to reduce the amount of manual saving and loading required for users who are evaluating or monitoring a large number of securities. IntelliCharts are the counterpart to chart templates: where a template saves the security-independant parts of a chart (colours, indicators, pane layout, etc), an IntelliChart saves security-specific annotations you’ve made to a chart.
Once IntelliCharts are enabled, you don’t have do a thing to use the power of IntelliCharts – once you’ve placed a line-study on the chart of a particular security, that line-study should return everytime you switch to that security.
A Five-Minute Introduction to IntelliCharts
Step 1. Annotate a security
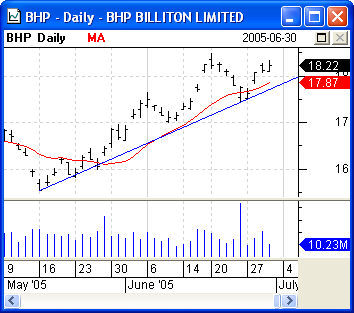
The first thing to do is set up a security. For example, here’s a simple BHP chart with a trendline and a 14-day Moving Average indicator:

Step 2. Switch to a different security
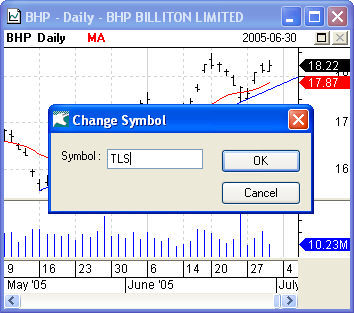
Using BullCharts’ quick-switch feature, switch to TLS by typing “TLS” and pressing Enter:
Step 3. Annotate the new security
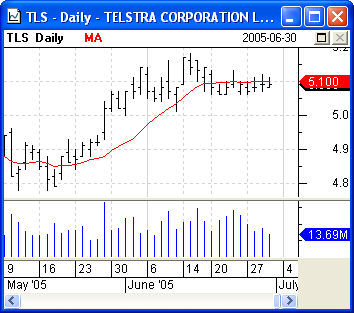
Having switched to TLS, notice that the line-study has disappeared (as it would not be relevant on the new chart) but the Moving Average indicator is still present:
Step 4. Switch back
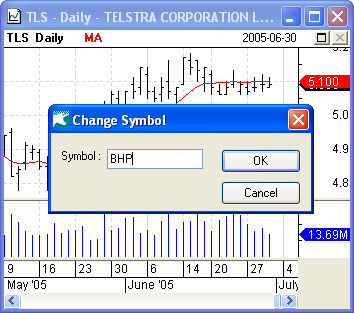
Using BullCharts’ quick-switch feature again, switch back to BHP:
Step 5: IntelliCharts at work
Having switched back to BHP, notice that the line-study has returned, back in its proper place:
IntelliCharts per time period
IntelliCharts can be set to have individual drawing tools per timeframe. This means you can have different trendlines for daily, weekly and monthly charts. The setting can be change in Tools/Preferences/IntelliCharts.
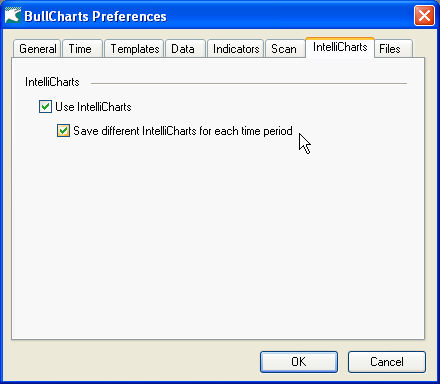
Use IntelliCharts will retain lines studies etc for a period chart. The default is on.
Save different IntelliCharts for each time period when selected, allows any line study to be applied to individual time periods. For example, you can draw a particular trendline for a daily chart and then a different trendline for a weekly charts. The option is off by default.
What gets saved in an IntelliChart?
Generally speaking, security-specific items will be automatically saved to an IntelliChart, while security-independent items will be ignored.
Some security-specific items might include:
- Trendlines
- Retracements
- Regressions
- Rulers
- Most other line-studies from the toolbar on the left of the BullCharts window.
- Space to right
- Time period if option select
Some security-independent items might include:
- Indicators (a 14-day Moving Average can be applied to any chart, for example)
- Pane background colour
- The colour of the price plot
- The time-frame and period
- The style of plot – candlesticks, OHLC bars, Point and Figure, etc.
Although many items can be categorised automatically, some items might be security-specific or security-independent depending on context:
- Vertical and horizontal lines.
- Data-dependent line tools (Linear regression tool, the compound candle, etc)
- Symbol overlays (The All Ordinaries index overlaid on a regular security is not security-specific, however an option overlaid on the option’s underlying security is).
- The text tool: “I bought BHP here” would probably be security-specific, “The market crashed here” would probably be security independent.
All line-studies default to being security-specific, but can be marked as security independent – which means they won’t be saved in IntelliCharts, and they will persist when you switch from one security to another (although they may not be visible, if the new security’s price is wildly different). To change the behaviour of a line-study, double-click on the line-study to open the Properties dialog. On the Advanced tab, there should be a checkbox marked “This tool is relevant to this security only”:
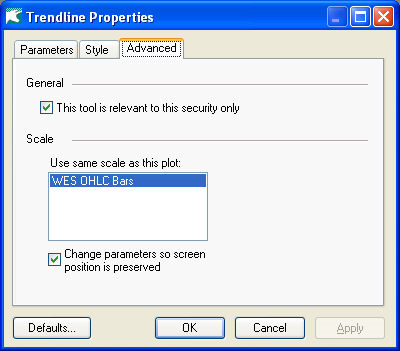
If the box is ticked (as shown above), the line-study is treated as security-specific. Otherwise, the line-study is treated as security-independant.
When are IntelliCharts Saved and Loaded?
When are IntelliCharts saved?
- When the current chart is switched to a new symbol, the security-specific information is saved to the old symbol’s IntelliChart and removed from the current chart.
- When the current chart is closed, the security-specific information is saved to the symbol’s IntelliChart.
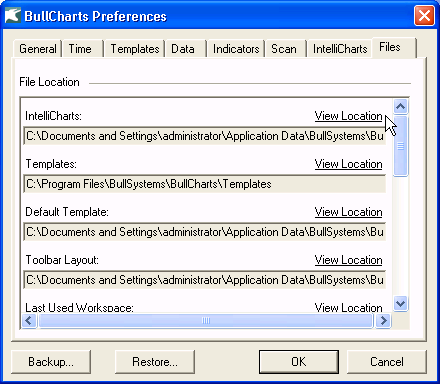
Where are IntelliCharts saved?
- IntelliCharts for symbols loaded from BullStore (BullCharts’ internal database) are saved to a folder named “BullCharts IntelliCharts” inside the same folder that contains the Last Workspace file.
- To find this folder, choose Preferences from the Tools menu. On the Filesl tab, click “View Location” for IntelliCharts.
-
IntelliCharts for symbols loaded from a MetaStock folder are saved to a folder named “BullCharts IntelliCharts” inside that MetaStock folder.
When are IntelliCharts overwritten?
- If more than one chart of the same symbol is open at once, then the IntelliChart will represent the contents of the last chart to be closed or have its symbol changed – any changes made to any of the other charts will be lost forever.
- If two or more charts are closed simultaneously (by choosing Close Workspace or Exit from the File menu), BullCharts chooses one at random.
When are IntelliCharts loaded?
- IntelliCharts are loaded when an existing chart has its symbol changed.
- IntelliCharts are loaded when you create a new chart from a template.
- Opening an existing, saved chart (or a workspace containing a chart) will not include the IntelliChart associated with that symbol, however the IntelliChart will be overwritten when you close the chart (or workspace) again.
IntelliCharts in Detail
Although the IntelliCharts feature is designed to be simple and easy to use, BullCharts is a large and intricate system and occasionally IntelliCharts might save and restore an item you thought would be ignored, or might ignore an item you were expecting to be kept. This section will describe the inner workings of IntelliCharts in detail, to help you understand any seemingly strange behaviour you observe.
First, some notes on terminology:
- When BullCharts applies a new template to an existing chart, it loads the new template then moves any security-specific information across. When an existing chart has its symbol changed, BullCharts removes any existing security-specific information, then loads the new security-specific information and applies it to the chart. In both cases, BullCharts can be said to be applying security-specific information to a template – although the template can just be “the existing chart”, rather than a specific BullCharts Template file. Any mention of “the template” on this page also refers to “the chart whose symbol is being changed”.
- IntelliCharts generally deal with items drawn on a plot – line-studies, regressions, icons, text, etc. Collectively, these items will be called “drawn items”.
- Drawn items can be drawn on the main price plot, or an indicator, or a symbol overlay. Collectively, these items will be called “plots”.
The IntelliCharts Combining Rules
When a new template is applied to an existing chart, BullCharts needs to combine the new security-independent information with the old security-specific information. When an existing chart has its symbol changed, BullCharts needs to combine the new security-specific information (including any drawn items from the new symbol’s IntelliChart) with the old security-independent information. Either way, BullCharts has a collection of rules for combining security-independent and security-specific data, called the Combining Rules.
The rules:
- Only drawn items are copied from the IntelliChart to the template.
- The Tool-tip tool and the training date mask, although technically drawn items, are always ignored.
- Any drawn items that have the primary price-plot as their scale parent (see Scale Parents Explained below) are added and bound to the new primary price-plot.
- Any drawn items that have the primary volume-plot as their scale parent (see Scale Parents Explained below) are added and bound to the new primary volume-plot.
- If the volume plot and/or volume pane don’t exist in the template, then a volume pane and volume plot are added according to the same rules used by the “Show Volume” item in the View menu.
- Any drawn items that have no scale parent (see Scale Parents Explained below) are removed, since there’s no way to tell which pane of the template they should be placed in.
- Any drawn items that have an indicator or symbol overlay as their scale parent are not immediately added to the plot or discarded – they’re stored in the Unused Item Container. BullCharts then goes through the Unused Item Container, and places as many items as possible on the chart. For more details, see The Unused Item Container below.
The Unused Item Container
Items drawn on a price-plot (technically, drawn items whose Scale Parent is a price-plot – see Scale Parents Explained below) can safely be loaded from a symbol’s IntelliChart because that symbol is always going to be present. However, items drawn on any other plot cannot always be safely loaded because those plots might not exist in the new template.
BullCharts’ solution is to load the drawn items and store them in the Unused Item Container. At certain times, BullCharts goes through the unused items and tries to match each item with the available plots on the chart. If a drawn item in the Unused Item Container can be matched with a suitable plot on the chart, BullCharts takes it out of the container and adds it to that plot.
- A security overlay is suitable if it refers to the same security that the drawn item’s original Scale Parent referred to.
- An indicator is suitable if it has the same name and parameter values as the drawn items’ original Scale Parent.
BullCharts tries to match drawn items in the Unused Item Container with plots on the chart in two situations:
- When the IntelliChart is first applied to a template.
- When a new plot is added to the chart.
Note that if you add an unsuitable indicator to a chart, then edit its parameters so that it becomes suitable, BullCharts will not add any drawn items from the Widget Box to it. Likewise, if you add a suitable indicator (which gets its share of drawn items added to it) then change the indicator parameters, the drawn items will not be removed from the chart.
A brief demonstration of the Widget Box in action:
- Create a new chart for BHP.
- From the Insert menu, choose Security. The “Insert New Symbol” dialog appears.
- Enter the symbol TLS, select “New Pane” then click OK.
- Select the Horizontal Line tool from the toolbox on the left, then click on the lowest point of the TLS plot to add a horizontal line there.
- From the Insert menu, choose Security again.
- Enter the symbol TLS, select “New Pane” then click OK once more.
- Select the Horizontal Line tool yet again, then click on the highest point of the second TLS plot to add a horizontal line.
- Now you should have three panes – a BHP price-plot, a TLS price-plot with a horizontal line below, and a TLS price-plot with a horizontal line above.
- Close the chart, and if prompted, do not save changes. The two horizontal lines are saved into the BHP IntelliChart.
- Create a new chart for TLS.
- Note that the horizontal lines do not appear, since they’re part of the BHP IntelliChart, not the TLS one.
- Switch the TLS chart to BHP.
- The horizontal lines have now been loaded, but because there are no suitable security overlays, they are being held in the Widget Box.
- From the Insert menu, choose Security once again.
- Enter the symbol TLS, select “New Pane” then click OK.
- Now that a suitable security overlay has been added to the chart, both the relevant drawn items have been added to it.
Scale Parents Explained
Plots either have their own value axis, or share a value-axis with another plot. Although drawn items can exist on their own value-axis, typically they have a “Scale Parent” – they should always be drawn on the same axis as a particular plot. Note that this is not the same thing as sharing a value axis with the plot: if the plot is assigned to a new value axis – say, an indicator that was sharing the right hand axis is being moved to the left – then the drawn items drawn against that plot should also move to the new value axis, rather than staying with the old.
When the drawn item is first drawn onto the chart, the closest plot of any kind is assigned as the drawn item’s scale parent – unless the plot in question shares the value axis with the primary price plot, in which case the primary price plot becomes the drawn item’s Scale Parent.
There are two ways for a drawn item to wind up with no Scale Parent at all:
- Items drawn on a pane which contains no plots at all will have no Scale Parent.
- Drawn items whose Scale Parent has been deleted from the chart will have no Scale Parent.
- This is the only way a drawn item’s Scale Parent can be altered after the drawn item has been drawn.
In both these cases, the item is drawn directly against a value axis, and is ignored by the IntelliCharts system.
Note that data-aware drawn items such as Compound Candles, Linear Regressions, etc. always use their Scale Parent’s data source.