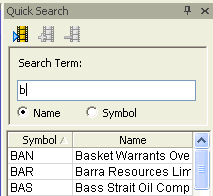
Stock Symbol Search
Symbol Search is helpful if you know the name of the company, but not its symbol, or if you know an ASX symbol, but are not sure of what company it represents.
Symbol Search has two different modes. The first is for Stocks and other security types; the other is specifically for Options and Warrants. The Stocks mode is the default.
Quick Symbol Search
Quick Symbol Search
The Quick Symbol Search works when you are not connected to the Internet. It is part of the Security Manager. There is a new tab at the bottom.
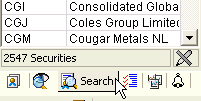
The Quick Symbol Search allows you to search on a whole word or part of a word. The default is a partial search. Some examples are:
| Example | Results |
| b | will display all stocks starting with ‘b’ |
| gold | will display all stocks starting with ‘gold’ |
| %b% | will display stocks that contain ‘b’ |
| %oil% | will display stocks that contain ‘oil’ |
| %b | will display all stocks ending with ‘b’ |
| %mining | will display all stocks ending with ‘mining’ |
Online Symbol Search for Stocks
When you are connected to the Internet, you will have additional search options. Symbol Search for stocks allows you to search for stocks by default, but also allows you to search for other security types.
Symbol Search for Stocks
Search Types
There are four different types of searches you can use. These are:
- Contains
- Begins with
- Exactly matches
- Sounds like
Contains
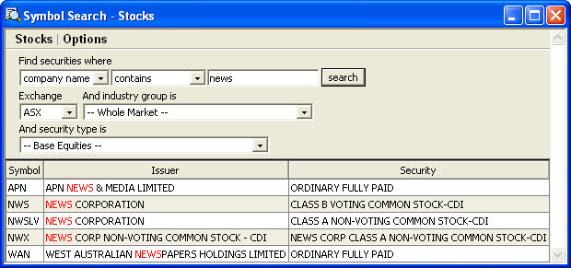
To search for companies based on a part of a name, select either company name or symbol from the first menu. Select Contains from the second menu, then enter your search query in the third menu. Click Search to start the search. You may for example want to find all ASX listed companies that have the word news in their name. You would use the Contains search to do this.
Begins With
The Begins with search allows you to find all securities whose name or ASX symbol begins with a certain search term. For example, to find all securities whose ASX symbol begins with the letters tl, select Symbol from the first menu, begins with from the second, then type tl into the third menu and click Search. This will return all ASX symbols beginning with tl, including Telstra Corporation.
Exactly Matches
The Exactly matches search allows you to search for an exact company name or ASX symbol. You may know for example, that there is an ASX symbol PNH, but you do not know the name of the company. You would select Symbol from the first menu, Exactly Matches from the second, then type PNH into the third. Next click Search to begin the search. This search would reveal that the symbol PNH belongs to the company Pineapplehead Limited.
Sounds Like
The Sounds Like search is helpful when you have heard of a company, but are not sure how the name is spelt. You may for example, have heard of a company that sounds like monadelfus. If you select company name from the first menu, sounds like from the second menu, then type monadelfus into the third, then click Search. You will see that the company is called Monadelphous Group Limited, and their ASX symbol is MND.
Restricting Symbol Searches
Within Industry Groups
You can restrict your search to securities only in a particular GICS industry group. To do this, enter your search criteria in the first three fields, then select an industry group from the Industry Group menu. Click Search to begin the search.
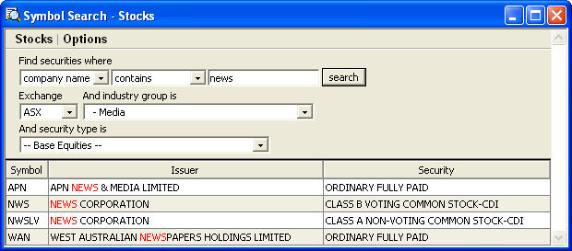
Securities in the media group with a company name containing the word news.
Within Security Types
You can restrict your search to certain security types. To do this, enter your search criteria in the first three fields, then select a security type from the Security Type menu. Click Search to begin the search.
Symbol Search for Options
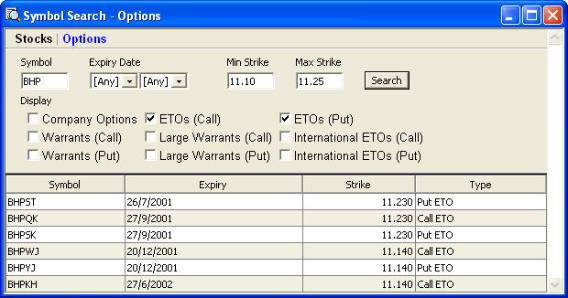
Symbol Search for options is accessed by clicking Options at the top left of the symbol search window, next to Stocks. The Options Search is designed to allow you to search for options and warrants that fall within certain strike prices or expiry dates.
To start an options search, type the symbol of the underlying security in the Symbol field, select the security types you wish to display by selecting the relevant check boxes, then click Search.
- Restricting Searches to an Expiry Date
To restrict your search to a particular expiry date, select the month and year of expiry from the Expiry Date fields. Enter the symbol and any other desired criteria, then click Search.
- Restricting Searches to a Range of Strike Prices
To restrict your search to a range of strike prices, enter the minimum and maximum strike prices in the Min Strike and Max Strike fields. Enter the symbol and any other desired criteria, then click Search.
Symbol Search for Options and Warrants
Stacking Indicator Panes
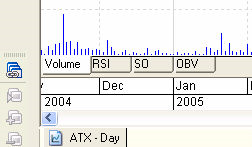
A useful feature of BullCharts allows you to stack the indicators into one pane. This helps focus on the price chart and one indicator at a time. Then you are able to switch back to the normal tiled mode to see all indicators at one time.
Toggling stacking of indicators
Toggle stacking of indicator panes
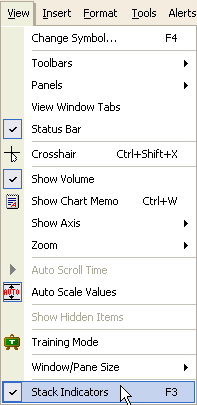
To enable or disable the stacking of indicators, you can toggle the Stack Indicators option by either clicking View and then Stack Indicators or just by pressing the F3 key.
Stacked indicator panes
To change the current stacked indicator pane, simply just click on the desired indicator tab.
Rearranging your Windows
Tile Windows
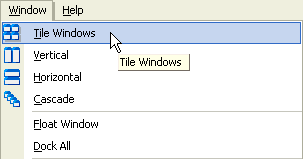
Select Tile Windows
Selecting Tile Windows repositions and resizes the windows to fit in the main BullCharts window in a tile formation.
Vertical Cascade Windows
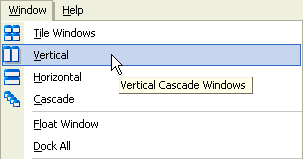
Select Vertical
Selecting Vertical repositions and resizes the windows to fit in the main BullCharts window in vertical columns.
Horizontal Cascade Windows
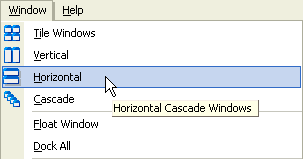
Select Horizontal
Selecting Horizontal repositions and resizes the windows to fit in the main BullCharts window in horizontal rows.
Cascade Windows
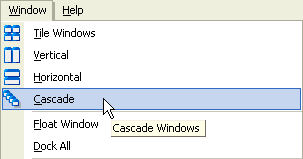
Select Cascade
Selecting Cascade repositions and resizes the windows so they overlap each other with the title bars visible.
Float Window
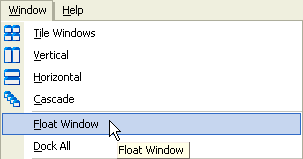
Select Float Window
Selecting Float Window moves the selected window out of the main BullCharts window so they it can be moved and resized independent of the main BullCharts window. For users of dual monitors, this provides additional work space. Note: Float Window is only implemented for Chart windows. Other windows such as Market Depth and various reports can only be used within the main application.
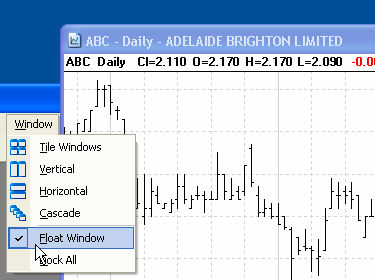
Example of a floated window
Dock All
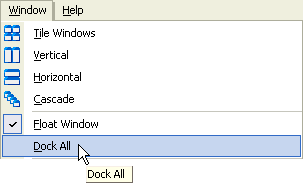
Select Dock All
Selecting Dock All moves all floated windows back into the main BullCharts window.
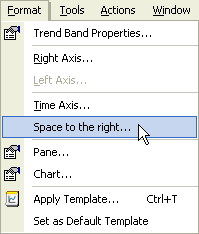
Space to the Right of Chart
Some users may wish to draw trendlines into the future. This is easily achieved by creating space to the right of the chart. Select Format then Space to the right…
To set the space to the right of chart, open the Format menu then select “Space to the right…”.
The Set Space to the Right of Chart dialog should appear.
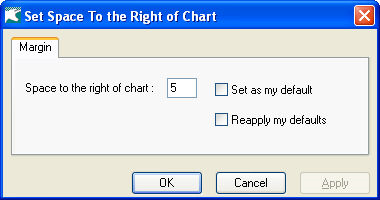
In this dialog, you can set the space to the right of chart. The options for setting space to the right of chart are listed as follows:
Space to the right of chart sets the number of bars/periods to the right of the chart to allow applying lines studies more easily such as to draw a trendline into the future.
Set as my default will save the current setting as the default for all new charts opened. Charts already created will retain the previous setting.
Reapply my defaults will revert back to the defaults if that chart had a customised setting.
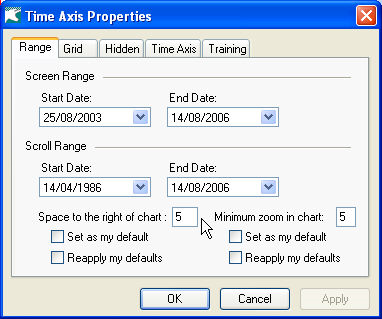
Space to the right can also be set in the Format/Time Axis
Copying Symbols
BullCharts allows you to conveniently export symbols and their associated company names for use in other applications through the security manager. This eliminates the need to manually symbols and company names from BullCharts when working in other applications at the same time and saves time when large lists of symbols copied outside of BullCharts.
Selecting Symbols
Select a single symbol
To select a single symbol, click on the desired symbol in the list of symbols.
Select a range of symbols
To select a range of symbols, click the first symbol, hold the Shift key, click the last symbol and then release the Shift key.
Select multiple symbols
To select multiple symbols, click the first symbol, hold Ctrl, click any additional symbols you want to select and then release the Ctrl key.
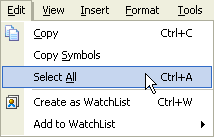
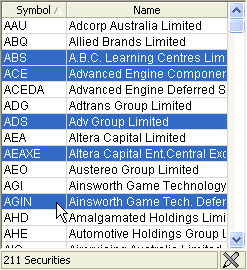
Select all symbols
To select all symbols, click on the Edit menu and then click on Select All. Note: You may also select all symbols by pressing Ctrl+A.
Copying/Moving Symbols between WatchLists
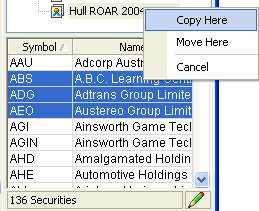
Copy/move symbols between WatchLists
To copy symbols between WatchLists, use the right-hand mouse button to drag the selected stocks to the nominated WatchList, release the mouse and a menu option will appear. Select either Copy or Move to complete the action, otherwise click Cancel to cancel.
Copying Symbols to Clipboard with Headers
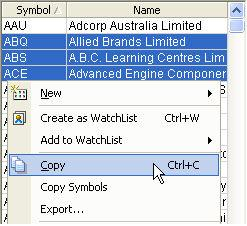
Copy symbols to clipboard with headers
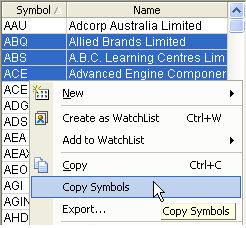
To copy the selected symbols with headers to clipboard, right-click on one of the selected symbols and then click on Copy. Alternatively to copy all symbols in a WatchList with headers to clipboard, you can also right-click the WatchList and click Copy.
Note: In both cases, you may also copy the selected symbols with headers to clipboard by pressing Ctrl+C instead of right-clicking an item and then clicking Copy.
Copying Symbols to Clipboard without Headers
Copy symbols to clipboard without headers
To copy the selected symbols without headers to clipboard, right-click on one of the selected symbols and then click on Copy Symbols. Alternatively to copy all symbols in a WatchList without headers to clipboard, you can also right-click the WatchList and click Copy.
Note: In both cases, you may also copy the selected symbols without headers to clipboard by pressing Ctrl+C instead of right-clicking an item and then clicking Copy.
Exporting Symbols to File
Export symbols to file
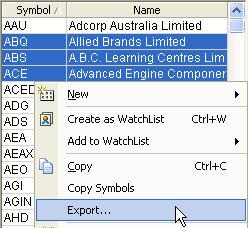
To export the selected symbols to file, right-click on one of the selected symbols and then click on Export.
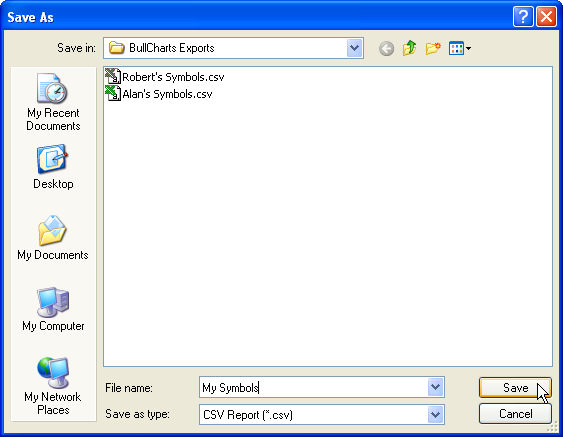
Select location to save exported symbols
After selecting export, a file dialog will be displayed on the screen. Navigate to the location you want to save the exported symbols, change the file name to a desired name you want to save the exported symbols to and then click on the Save button to save the exported symbols.
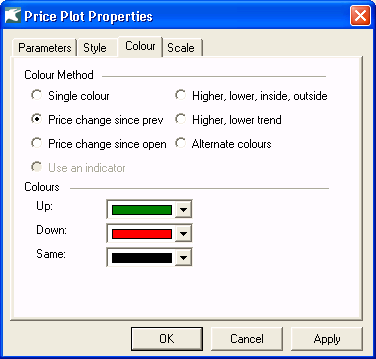
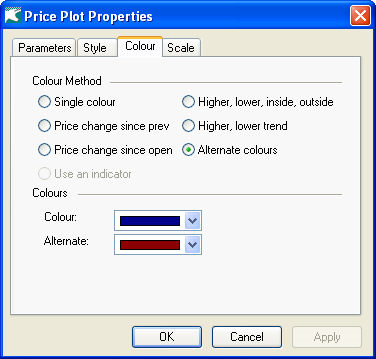
Stock Movement Bar Colour System
BullCharts can display a colour scheme or colour method for the price plot to provide additional information on the movement of the stock.
Single colour
Single colour is the default colour system with no indication of price movement.
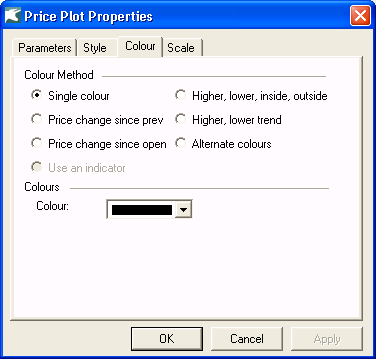
Price change since prev
Price change since prev provides additional information in a chart by adding a colour based on the movement from the previous close.
Up indicates that the stock has risen in price since the previous close.
Down indicates that the stock has dropped in price since the previous close.
Same indicates that the current stock price is unchanged from the previous close
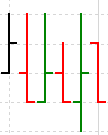
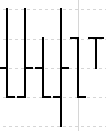
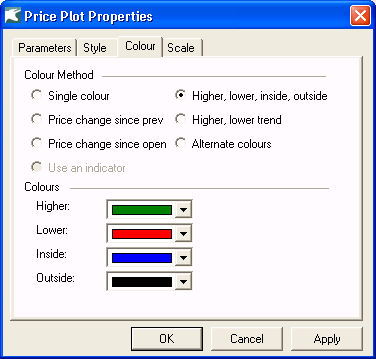
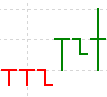
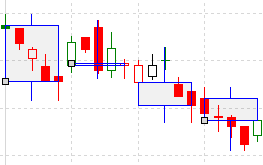
Higher, lower, inside, outside
Higher (see bar 3) means the High is higher than the previous high.
Lower (see bar 4) means the Low is lower than the previous low.
Inside (see bar 5) means:
High is lower than or equal the previous High and
Low is greater or equal than the previous Low.
Outside (see bar 2) means:
High is greater than the previous High
Low is less than or equal to the previous Low
OR
High is greater than or equal to the previous High and
Low is less than to the previous Low
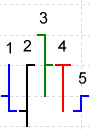
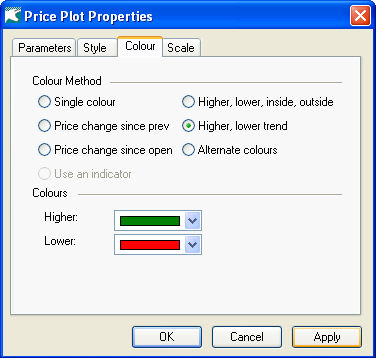
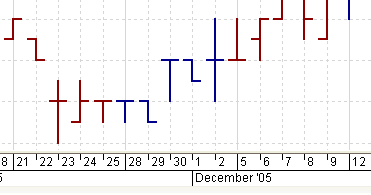
Higher, lower trend
Higher means:
High is greater than the previous High and
Low is greater the previous Low
Lower means:
High is less than the previous High and
Low is less than the previous Low
Alternate colours
This option provides a colour variation based on the time period. If the period is daily then the colour will highlight the weekly period and so on for monthly etc.
Colour is the default colour for a time period.
Alternate is the colour to identify the next time period.
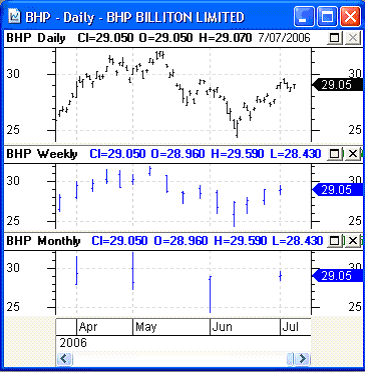
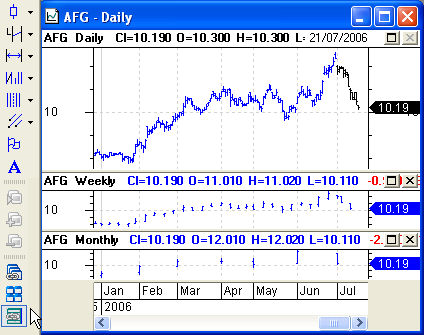
Multiple Timeframes
An important trading strategy is to analyze the trend of a stock based on different timeframes. With Multiple Timeframes, different timeframes are synchronized when scrolling. The synchronized timeframes provides more detailed analysis of a stock when comparing short, medium and long term trends which otherwise may not be apparent with other methods.
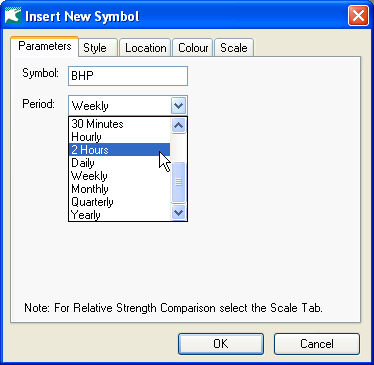
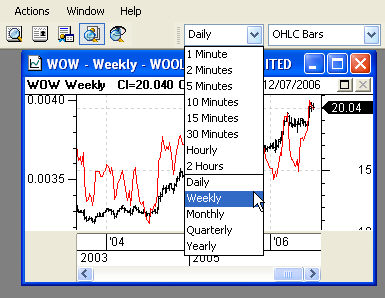
Insert a security
A stock can be inserted on to a chart with any time frame, for example – daily, weekly or monthly using the Insert/Security menu. Chart Style, location, colour and scale can all be selected from the relevant tab.
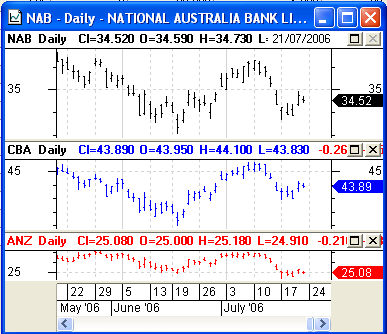
Multiple securities on one chart
In addition, the Multiple Timeframe option allows you in one chart to have multiple stocks and multiple time frames. For example, you could compare two banking stocks CBA and NAB in the same chart. This allows for synchronized scrolling in the chart to better compare performance of each stock.
Overlay candlesticks
An interesting option is to overlay a different timeframe on the same stock rather than ‘side by side’ as with a new pane. This can be particularly effective with Candlesticks. In the example below, a weekly candlestick is overlaid on a daily candlestick to reveal new patterns more clearly.
Change time period
To change the time period of a stock, select the price plot with your cursor then from the drop down menu select a new time period just for that stock.
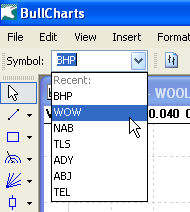
Change security
To change the stock in that pane, select the stock then from the main Symbol drop down box then press Enter on your keyboard.
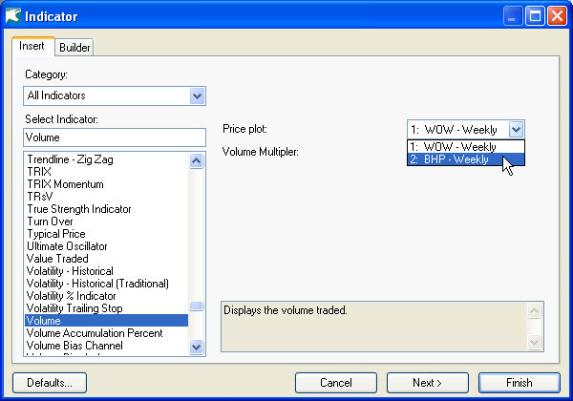
Insert Volume
To add volume for the secondary price plot, use Insert/Indicators then Volume. In the Price Plot parameter, select the price plot that you wish to link the Volume to.
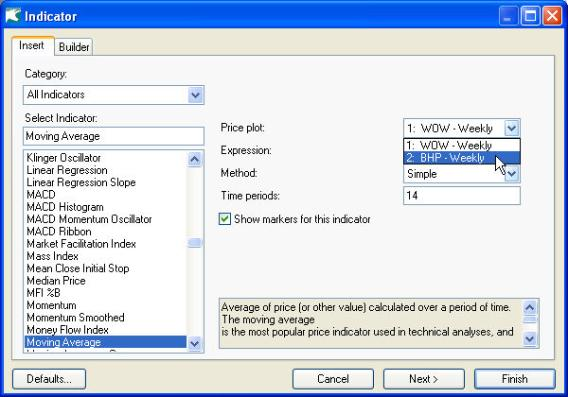
Insert indicator
To inset an indicator on any timeframe, select Insert/Indicator. For the relevant indicator, select the price plot to link the indicator to. The location will be automatically selected or may be changed by clicking the Next button then the Location tab.

Synchronise each pane to the primary stock symbol
Multiple timeframes can be used in two different ways. To display different stocks such as banking stocks within the same chart window or display the primary stock across all timeframes. To synchronise each pane to display the same stock symbol, click on the Synchronise pane button on the left.
Synchronsied with the primary plot

If synchronise panes was off, then you can display different stocks in the chart. The example below shows three banking stocks in the same chart. They can have different time frames or the same timeframe as well. Changing the stock symbol would only change the primary price plot. To change the other stocks, select the price plot line then change the symbol in the Symbol box.

Template
If wish to retain your preferred multiple timeframes, then you could create a template. The time frames are universal, not per stock. If you save the layout of the chart as a template, it will also save the synchronise state. If synchronise panes is on, applying the template will display the primary stock symbol in each pane. Relative Strength Comparison will still retain the same index used for comparison for example XAO.
If the synchronise panes is off, then the template will save any secondary stock symbols as well as the timeframes and settings for Relative Strength Comparison. For example with the banking chart, the primary plot is NAB (normally black). The secondary plots are CBA and ANZ. Saving this as a template without synchronise panes on will retain CBA and ANZ in the template.
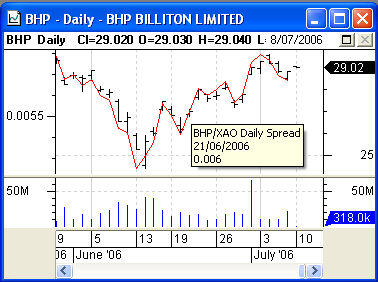
Relative Strength Comparison
Relative Strength Comparison (RSC) allows you to effectively compare a stock against an index using the scale for both. This helps to analyze the stock’s performance compared to the index.
To insert an RSC, select Insert/Security. Enter the index, for example XAO. The timeframe is not relevant as this is determined by the stock. Select the Scale tab, then Relative Strength Comparison. A list of stock price plots on the chart will display.
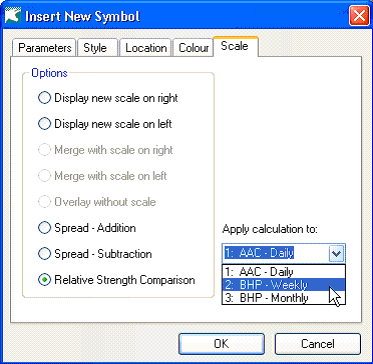
Select the stock you wish to compare with the index. The location is automatically selected as an overlay on the price plot. The location can be changed to a different pane by using the Location tab.
Once inserted, a line will overlay the share price chart with a new scale on the left hand side.