Keyboard Shortcuts
Keyboard shortcuts are combinations of keys that when pressed perform a particular operation. Useful keyboard shortcuts available are:
| This | Is a shortcut to |
|---|---|
| ALT + ENTER | Bring up the Properties box |
| CTRL + A | Select all stock symbols in the list |
| CTRL + C | Copy |
| CTRL + E | Insert a stock symbol overlay on the same chart |
| CTRL + G | Data Manager |
| CTRL + I | Insert an indicator |
| CTRL + N | Open new chart |
| CTRL + O | Open chart, workspace or template |
| CTRL + P | |
| CTRL + R | Repeat the last selected drawing tool |
| CTRL + S | Save chart of workspace |
| CTRL + T | Open a saved template |
| CTRL + W | Create a watchlist from the selected stock symbols or create a copy of the selected watchlist |
| CTRL + A + W | Select all stock symbols in the list and create a new watchlist |
| CTRL + F4 | Close selected window |
| CTRL + TAB | Cycle left through the tabs of the open charts |
| CTRL + Shift + TAB | Cycle right through the tabs of the open charts |
| CTRL + DEL | Delete all drawing doors on screen |
| CTRL + Shift + X | Cross hairs drawing tool |
| DEL | Delete selected object |
| F1 | Help |
| F2 | Edit watchlist name or symbol |
| F3 | Stack the indicator panes |
| F4 | Change the stock symbol on the currently selected chart |
| F5 | Refresh Web based reports in the Actions Menu |
| F6 | Securities Manager |
| F7 | Maximise/Restore chart pane |
| F8 | BullScan Manager |
| F9 | Maximise/Restore current screen |
| F11 | Full screen mode |
| Shift + Delete | Watchlist: Delete a row without prompting |
| F12 | Save chart as a different file name |
| HOME | Start of the chart in time – the first date |
| END | End of the chart – current date |
| + (on key pad) | Zoom in on chart |
| – (on key pad) | Zoom out on chart |
| Scroll wheel | Navigate to the start or end of the chart |
| PG DN | Scroll to the left on the chart |
| PG UP | Scroll to the right on the chart |
Available Columns in Security Summary
52 Week High/Low
The highest and lowest price at which the security has traded over the past 52 weeks.
Asset Backing
Also known as Net Tangible Assets (NTA). Refers to the net assets owned by shareholders of the company at balance date, divided by number of shares.
Current Dividend Amount
The value of the latest dividend.
Dividend Paid Month
Represents the months in which the issuer has historically paid a dividend over the last 4 payments. The most recent month appears first.
Dividend Payable Date
The date on which the latest dividend was or will be paid.
The rolling 12 month total of dividends paid per share.
Dividend Type
Indicates whether the most recent dividend was a final or interim payment.
Dividend Yield
Dividend rate per share divided by last price. An indication of the income generated by a share of stock.
A rolling 12 month total of company earnings divided by the number of shares on issue.
Earnings Yield
The earnings per share for the last 12 months divided by last price in cents.
Ex Dividend Date
The date from which purchasers of the security will no longer be eligible for the upcoming dividend payment. That is, to be eligible for an upcoming dividend, you must purchase the security before the ex dividend date.
First Listed Date
Field should be renamed to first active date
First Traded Date
Field should be renamed to first quoted date
Franked Percent
The portion of the dividend on which taxation has already been paid.
GICS Code
The code denoting the complete GICS classification for the security.
GICS Industry
The GICS industry to which the security belongs.
GICS Industry Group
The GICS industry group to which the security belongs.
GICS Sector
The Global Industry Classification Standard (GICS) is a global standard for the classification of securities into Industry groups. It has four levels, ranging from Sector as the most general grouping, to Sub Industry as the most specific. GICS Sector refers to the Sector that the security belongs to.
GICS Sub Industry
The GICS sub industry to which the security belongs.
Gross Dividend Amount
Total dividend amount, including all tax payable on the dividend. The gross dividend amount will be greater than the current dividend amount if the dividend is franked.
Issuer Name
The full name of the company that issued the security.
Issuer Type
The classification of the issuer. This may be Industrial, Mining, Oil, Australian Government, State/Semi-Government or Undefined.
Last Active Date
The date that the security will be permanently removed from the securities database. Most normal equities will have no last active date. For derivatives, this is the last date that the derivative is available for trading before expiry.
Market Capitalisation
The total value of all of the securities on issue. This value is determined by Total Issued x Last Price.
Paid Up Value
Represents the amount of money that has been paid on any security that is only partly paid.
Price/Earnings Ratio
The ratio between last price and earnings per share. This can help to determine whether a share is over or under valued.
Quoted Removal Date
The date on which the security was or will be removed from official quotation.
Security Description
The full description of the security’s class. For example ordinary fully paid for ordinary shares.
Security Type
This describes the type of the security. It is for example, ordinary for normal shares.
Suspension End Date
The date on which a trading suspension was lifted. If there is no value in this field, and yet there is a value in the suspension start date field, then the security is still suspended.
Suspension Start Date
Date on which a trading suspension was imposed was imposed on a security. If no value exists in this field, then the security is not suspended.
Symbol
The ASX symbol for the security.
Total Issued
The total number of the securities on issue.
File Types used in BullCharts
BullCharts uses a number of different file extensions listed below.
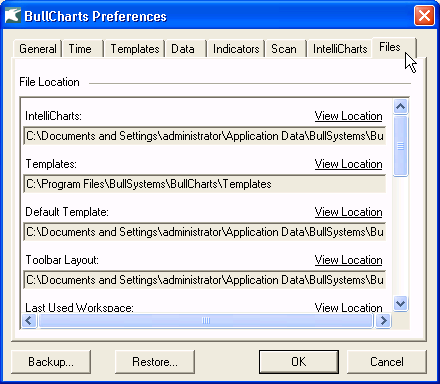
File Locations
In Tools/Preferences, the Files tab lists the location of all the major user files such as IntelliCharts, Default Template, Last Used Workspace, Template Folder, Custom Indicators, Custom Scans, WatchList, BullCharts Log.
| Name | Location |
|---|---|
|
Alerts |
C:\Program Files\BullSystems\BullCharts\BullAlerts |
|
BullCharts |
C:\Program Files\BullSystems\BullCharts |
|
BullStore Database |
C:\Program Files\BullSystems\BullCharts\BullStore_Data_2005.MDF |
|
BullStore Log |
C:\Program Files\BullSystems\BullCharts\BullStore_Log_2005.LDF |
|
BullCharts Log |
C:\Program Files\BullSystems\BullCharts |
|
Custom Indicators |
C:\Program Files\BullSystems\BullCharts\CustomIndicators |
|
Custom Scans |
C:\Program Files\BullSystems\BullCharts\CustomScans |
|
Default Scans |
C:\Program Files\BullSystems\BullCharts\DefaultScans |
|
Functions |
C:\Program Files\BullSystems\BullCharts\Functions |
|
Help |
C:\Program Files\BullSystems\BullCharts\Help |
|
Indicators |
C:\Program Files\BullSystems\BullCharts\Indicators |
|
Levels |
C:\Program Files\BullSystems\BullCharts\Levels |
|
Notes |
C:\Program Files\BullSystems\BullCharts\Notes |
|
Templates |
C:\Program Files\BullSystems\BullCharts\Templates |
|
WatchLists |
C:\Program Files\BullSystems\BullCharts\WatchLists |
|
Workspaces |
C:\Program Files\BullSystems\BullCharts\Workspaces |
Renko Charts
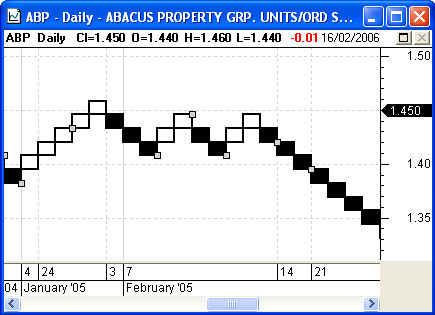
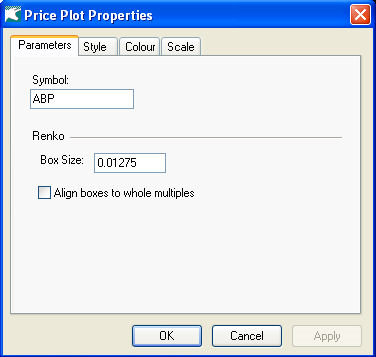
Align boxes to whole multiples will adjust the box size. Normally boxes would start from the first close. If Align Boxes is on then it will adjust it so that whole box sizes are used. For example, a box size of .2 would start on 1.8 or 2.0 but not 1.95.
Troubleshooting
I edited a raw BullScript file (.bss), but I cannot see my changes in BullCharts.
If you edit raw .bss files on your hard disk, you will need to restart BullCharts to see the changes. BullScript files are pre-loaded into memory when you start the program. It is recommended that you use the Indicator Builder to create and edit BullScript indicator files.
I created a new indicator by writing my own .bss file and putting it into the scripts directory. Why can’t I see the indicator in the “Insert Indicator” list?
Make sure that you have typed the extension (.bss) correctly. You will also need to restart BullCharts in order to see new indicators that you have created. See the question above for more information.
An error occurs with my new indicator when I start BullCharts, and it is not available in the Insert Indicator list.
BullScript files with syntax errors will be listed at startup of BullCharts and excluded from the available indicator list. For example, BullScript allows certain attributes to be added, such as a description or citation tag. The text needs to be valid and so not include certain characters that may be used elsewhere with BullScript. For example ” is not allowed within an attribute tag as it is used as a text delimiter in BullScript. If ” is required then there should be an open and close pair of ” to delimit the text.
I cannot see any of the MetaStock data options.
The MetaStock tools are only available once BullCharts has been activated. Contact BullSystems if you have not received an activation key. The MetaStock tools are not available on the BullCharts demo.
The web reports are only available if your data source is currently set to BullSystems. They are also only available once you have connected to the server. Ensure that your Internet connection is work correctly, then attempt to log in using the Login option in the tools menu.
Glossary
Pivot Point
A technical indicator derived by calculating the numerical average of a particular stock’s high, low and closing prices.
The pivot point is used as a predictive indicator. If the following day’s market price falls below the pivot point, it may be used as a new resistance level. Conversely, if the market price rises above the pivot point, it may act as the new support level.
Reversal
A sudden change in the price direction of a stock, index, commodity or derivative security.
Also referred to as a “trend reversal”, “rally” or “correction”.
A reversal can be a positive or negative change against the prevailing trend. Technical analysts watch for these patterns because they can indicate the need for a different trading strategy on the same security.
For example, if a technical analyst holds stock ABC and notices a reversal pattern, he or she may want to consider closing his/her existing long position and assuming a short position to capitalize on the potential downward movement of the stock’s price.
Gap
A break between prices on a chart that occurs when the price of a stock makes a sharp move up or down with no trading occurring in between. Gaps can be created by factors such as regular buying or selling pressure, earnings announcements, a change in an analyst’s outlook or any other type of news release.
An example of two different gaps can be seen in the chart above. Notice how the stock closes the trading session before the first gap at $50 and opens the next trading day near $46 with no trading occurring between the two prices. Gaps are a regular occurrence in all financial markets. However, they are rarely seen in the forex market since it is highly liquid and trades 24 hours a day.
Oversold
A condition in which the price of an underlying asset has fallen sharply, and to a level below which its true value resides. This condition is usually a result of market overreaction or panic selling.
A situation in technical analysis where the price of an asset has fallen to such a degree – usually on high volume – that an oscillator has reached a lower bound. This is generally interpreted as a sign that the price of the asset is becoming undervalued and may represent a buying opportunity for investors.
Assets that have experienced sharp declines over a brief period of time are often deemed to be oversold. Determining the degree to which an asset is oversold is very subjective and could easily differ between investors.
Identifying areas where the price of an underlying asset has been unjustifiably pushed to extremely low levels is the main goal of many technical indicators such as the relative strength index, the stochastic oscillator, the moving average convergence divergence and the money flow index.
Oversold is the opposite of overbought.
Overbought
A situation in which the demand for a certain asset unjustifiably pushes the price of an underlying asset to levels that do not support the fundamentals.
In technical analysis, this term describes a situation in which the price of a security has risen to such a degree – usually on high volume – that an oscillator has reached its upper bound. This is generally interpreted as a sign that the price of the asset is becoming overvalued and may experience a pullback
An asset that has experienced sharp upward movements over a very short period of time is often deemed to be overbought. Determining the degree in which an asset is overbought is very subjective and can differ between investors.
Technicians use indicators such as the relative strength index, the stochastic oscillator or the money flow index to identify securities that are becoming overbought.
An overbought security is the opposite of one that is oversold.
Bear
An investor who believes that a particular security or market is headed downward. Bears attempt to profit from a decline in prices. Bears are generally pessimistic about the state of a given market.
For example, if an investor were bearish on the S&P 200 they would attempt to profit from a decline in the broad market index. Bearish sentiment can be applied to all types of markets including commodity markets, stock markets and the bond market.
Although you often hear that the stock market is constantly in a state of flux as the bears and their optimistic counterparts, “bulls”, are trying to take control, do remember that over the last 50 years or so the Australian stock market has continually increased. This means that every single long-term market bear has lost money.
Bull
An investor who thinks the market, a specific security or an industry will rise.
Bulls are optimistic investors who are presently predicting good things for the market, and are attempting to profit from this upward movement. For example if you are bullish on the S&P 200 you will attempt to profit from a rise in the index by going long on it. Bulls are are the exact opposite of the market’s bears, who are pessimistic and believe that a particular security, commodity or entity will suffer a decline in price.
Bullishness does not necessarily apply only to the stock market; you could for example be bullish on just about anything, including commodities like soy beans, crude oil or even peanuts.
Hook Reversal
A short-term candlestick pattern, occurring in either an uptrend or a downtrend, that is used to predict a reversal in the trend’s direction. The pattern is identified when a candlestick has a higher low and a lower high compared to the previous day’s candlestick. This pattern is unique because the difference in size between the first and second bar’s body is small, compared to that seen in other types of engulfing patterns.
If this pattern is found in an uptrend, then the open must be near the prior high, and the low must be near the prior low. This pattern is often classified as a type of harami position because the real body of the second candle forms within the body of the previous candle. It should be noted that the reversal suggested by this pattern is considered to be more significant if it is identified within a strong trend.
Divergence
A situation in which the price of an asset and an indicator, index or other related asset move in opposite directions. In technical analysis traders make transaction decisions by identifying situations of divergence, where the price of a stock and a set of relevant indicators, such as the MACD, are moving in opposite directions.
In technical analysis, divergence is considered either positive or negative, both of which are signals of major shifts in the direction of the price. Positive divergence occurs when the price of a security makes a new low while the indicator starts to climb upward. Negative divergence happens when the price of the security makes a new high, but the indicator fails to do the same and instead closes lower than the previous high.
Breakout
A price movement through an identified level of support or resistance, which is usually followed by heavy volume and increased volatility. Traders will buy the underlying asset when the price breaks above a level of resistance and sell when it breaks below support.
Spike
The comparatively large upward or downward movement of a price or value level in a short period.
The trade order execution confirmation slip which shows all the pertinent data, such as the stock symbol, price, type and trading account information.
A good example of a negative spike in the financial markets is the infamous stock market crash of Oct 19, 1987, when the DJIA plunged 22% in a single day. There are plenty of more common, less drastic examples which are periodically seen in individual stocks when unexpected news or events, such as better-than-expected earnings results, reaches investors.
This usage originates from the antiquated practice of placing paper trade order slips on a metal spike upon completion.
Volatility
A statistical measure of the dispersion of returns for a given security or market index. Volatility can either be measured by using the standard deviation or variance between returns from that same security or market index. Commonly, the higher the volatility, the riskier the security.
A variable in option-pricing formulas showing the extent to which the return of the underlying asset will fluctuate between now and the option’s expiration. Volatility, as expressed as a percentage coefficient within option-pricing formulas, arises from daily trading activities. How volatility is measured will affect the value of the coefficient used.
In other words, volatility refers to the amount of uncertainty or risk about the size of changes in a security’s value. A higher volatility means that a security’s value can potentially be spread out over a larger range of values. Meaning that the price of the security can change dramatically over a short time period in either direction. Whereas a lower volatility would mean that a security’s value does not fluctuate dramatically, but changes in value at a steady pace over a period of time.
One measure of the relative volatility of a particular stock to the market is its beta. A beta approximates the overall volatility of security’s returns against the market returns. For example, a beta value of 1.1 means that the security will return 110% compared what the market returns over a specified time period. Conversely, a beta of 0.9 will return 90% of the market’s total return.
Trailing Stop
A stop-loss order that is set at a percentage level below (for a long position) the market price. The price is adjusted as the price fluctuates.
This is such a useful tool, yet many fail to use it. Using a trailing stop allows you to let profits run while cutting losses at the same time.
Exit Strategy
The method by which a venture capitalist or business owner intends to get out of an investment that he or she has made in the past. In other words, the exit strategy is a way of “cashing out” an investment. Examples include an initial public offering (IPO) or being bought out by a larger player in the industry. Also referred to as a “harvest strategy” or “liquidity event”.
In the context of an active trader, a plan as to when a trade will be closed out.
It’s more difficult for a VC or entrepreneur to get money out of an investment because they are generally dealing with private companies. When a firm is private, the shares cannot be sold nearly as easily as when the firm is publicly traded on a stock exchange. So, even though a private startup firm could be worth millions of dollars, the VC/entrepreneur has little access to this wealth. You can think of the exit strategy as the first opportunity to trade an illiquid asset (shares in a private firm) for a very liquid asset (cash).
For example, a trader might set a stop-loss order to exit a trade if a stock drops a certain percentage.
Pyramiding
A method of increasing a position size by using unrealized profits from successful trades to increase margin.
An investor who is pyramiding uses excess margin from the increasing price of a security in his or her portfolio to purchase more of the same security. This is generally a slow method of increasing one’s position size as the margin increases will permit successively smaller purchases.
Short Selling
The selling of a security that the seller does not own, or any sale that is completed by the delivery of a security borrowed by the seller. Short sellers assume that they will be able to buy the stock at a lower amount than the price at which they sold short.
Selling short is the opposite of going long. That is, short sellers make money if the stock goes down in price.
This is an advanced trading strategy with many unique risks and pitfalls. Novice investors are advised to avoid short sales.
Long (or Long Position)
The buying of a security such as a stock, commodity or currency, with the expectation that the asset will rise in value.
In the context of options, the buying of an options contract.
Opposite of “short (or short position)”.
For example, an owner of shares in McDonald’s Corp. is said to be “long McDonald’s” or “has a long position in McDonald’s”.
For example, buying a call (or put) options contract from an options writer entitles the you the right, not the obligation to buy (or sell) a specific commodity or asset for a specified amount at a specified date.
Contributions from http://www.investopedia.com/