Frequently Asked Questions
Importing files in BullCharts
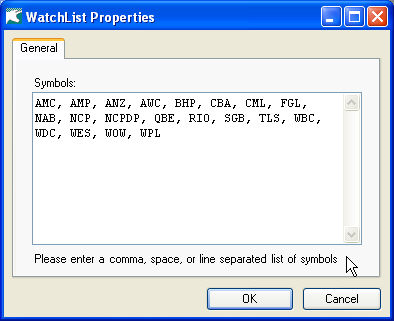
- Watchlists: You are able to import files into your watchlist by cut and paste the file into the Properties of the watchlist. To do this double-click on the watchlist name. This allows you to cut and paste a row or column of stock codes from Excel. Each stock symbol needs to be separate by a comma or space.
- Importing your own data: Rather than importing text or ASCII files, BullCharts has the ability to read files in Metastock format that can be used in conjunction with the ASX data used in BullCharts.
Supported File Formats – Metastock
- BullCharts provides data for the Australia Stock Exchange (ASX) as a default. However, BullCharts supports files in the Metastock format to give you flexibility in accessing data from another data provider. This opens up access to any stock market such as the NYSE, AMX, London Metals Exchange and so on. Further, this give you flexibility to combine analysis of Forex (Foreign Exchange Currency), data from the Sydney Futures Exchange or Commodities to compliment your study of stocks and equities.
- To access data in Metastock format, please request a Metastock Key from support at info@bullcharts.com.au. We will send a key and details on installing the key as well as details on how to access Metastock using the Data Sources option on the Data tab displayed in Preferences from the Tools menu.
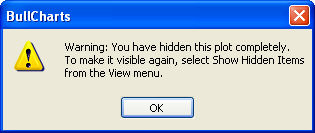
Hide a price plot
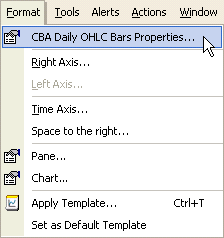
- Sometimes you may wish to hide the price plot of a stock to better analyze the indicators. To do this select the price plot for the stock. Then from the Format menu select Properties.
Next, select Hide this plot.
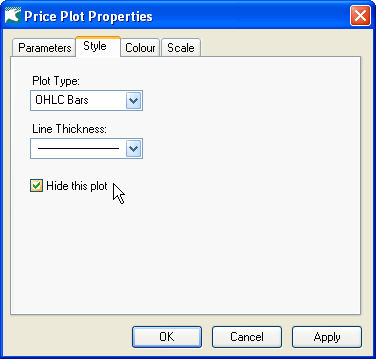
A message will display on how to unhide the plot from the View menu.
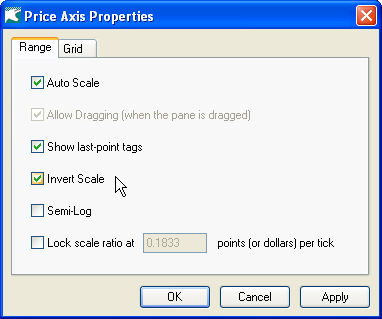
Inverting a chart
Some charting analysis require you to invert the chart. This can easily be accomplished by selecting the Invert Scale option from the Format Price Axis menu.
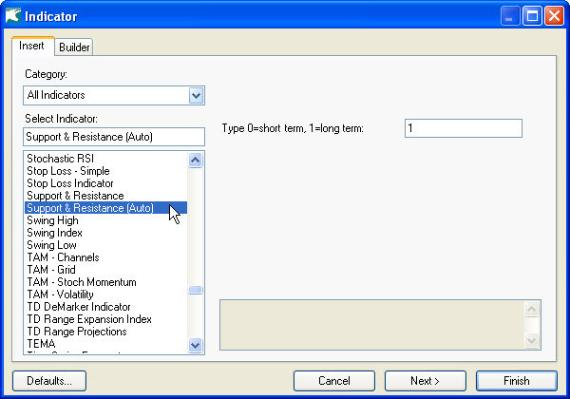
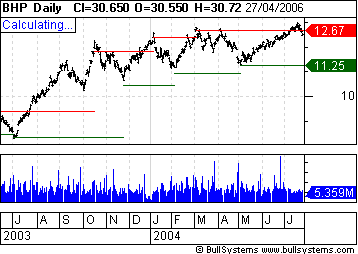
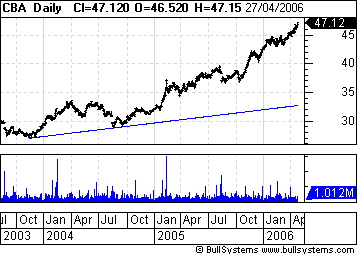
Automatic Support and Resistance Lines
BullCharts uses an indicator to display an automatic support and resistance line. Select Support & Resistance (Auto) from the Indicator menu.
Automatic Trendlines
BullCharts has the indicator call Trendline – Zig Zag to automatically draw a trendline. It uses the Zig Zag function to determine the trendline.
Guppy Count Back Lines
The Max Chase Line according to Darryl Guppy is “an arbitary calculation to prevent traders from chasing prices too high.”
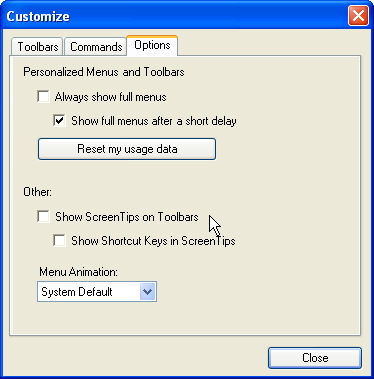
Turning off Tooltips for toolbars
BullCharts displays a tooltip when you hover over an icon in the toolbar. After a short delay it will disappear.
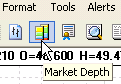
However, some users may not wish to display tool tips for toolbars. Tooltips can be disabled. On the View menu, click Toolbars then Customise. Click the Options Tab. Next, under Other, select or clear Show Screen Tips on toolbars and Show shortcut keys in ScreenTips. Then select Close.
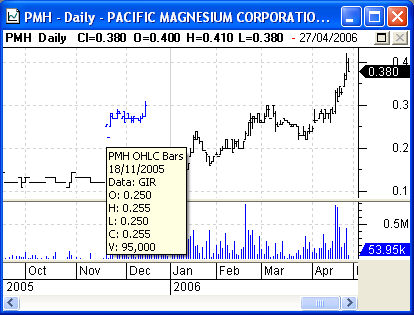
Company Name Changes
When a company changes its name, BullCharts will append the data from the previous stock to the new stock. In the example below, GIR had a name change to PMH. The price plot for the previous stock will be highlighted as a different colour, blue. The current stock will be in black. The tooltip for the blue price plot will display the previous stock symbol as well as the current one. In this case the data is for GIR but appended to PMH.
Darvas Box
Max volume breakout offset in the parameters means the number of bars or time period to look at. The default of 21 means that the Darvas Box indicator will monitor the last 21 bars to see whether there is a volume breakout within that time period.
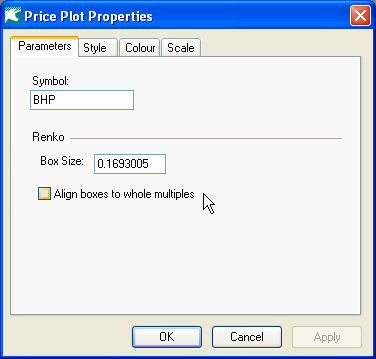
Renko
Align boxes to whole multiples in the price plot properties will round the number of the size of the box. Normally boxes would start from the first close. If Align boxes is selected, then the size is adjusted so that whole box sizes are used. For example, a box size of 0.2 would start from .18 or .20 but not .195.