Overview
Nicholas Darvas, author of “How I made $2,000,000 in the Stock Market” used a simple method for trading based on constructing boxes of trading ranges. BullCharts allows you to easily view and search for Darvas Boxes.
Important: The notes that follow, and their application, should not be interpreted as advice to buy or sell. Contact your broker or financial adviser for trading assistance.
Using Darvas Boxes in BullCharts
Viewing the Darvas Box Indicator
To add the Darvas Box indicator to your chart, follow these steps:
- Load the required chart
- Click on the Insert menu and select Indicator…
- Scroll down the list and locate Darvas Box (refer to the BullCharts help for tips on how to select indicators more easily).
- Press Finish
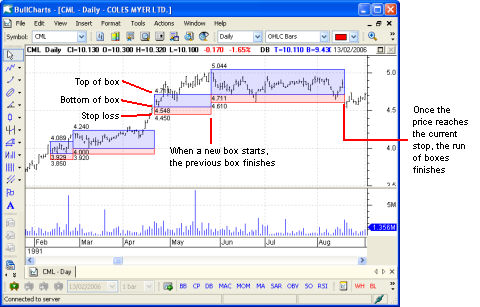
Note that because of the strict requirements for Darvas boxes, many securities may not display a box. See scanning below for tips on how to find Darvas boxes. Alternatively, view Coles Myer (CML) in the year 1991.
Tip: To make the price bars more visible, right click on them, select Order, then Bring to front. Alternatively, select Propertiesand make the lines thicker.
Interpreting Darvas Boxes
For a full discussion of Darvas boxes, please refer to Nicholas Darvas’ own book “How I made $2,000,000 in the Stock Market”. As a briefoverview, Darvas drew boxes when certain conditions were met:
- The price had reached a new high (over 250 bars by default in BullCharts)
- A volume breakout is required for the first box in a series.
- The high was followed by 3 consecutive days that did not trade higher. This formed the top of the box, and the first day of the box.
- On or after the high, a low is found that is followed by 3 consecutive days that did not trade lower. This forms the bottom of the box.
- In BullCharts, a stop-loss level of 2% below the bottom line is used. This, and other parameters, can be accessed in the Darvas box properties. Right click the Darvas boxes and select Properties.
Searching for Darvas Boxes
Darvas had strict requirements for investing in a security. Therefore a large number of securities will not show any Darvas Boxes on them. To find securities that are currently within a Darvas Box, we can use one of the Darvas Market scans. Follow these steps:
Finding the Darvas Scans
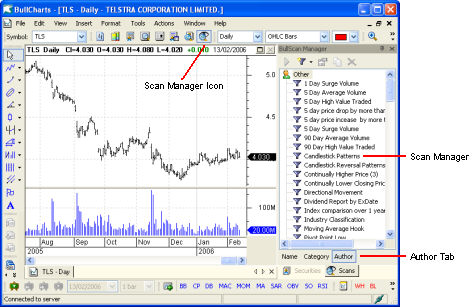
First, open the Scan Manager and locate the Darvas Scans, as follows:
- Click on the Scan Manager icon

 on the toolbar (or select BullScan Manager from the tools menu).
 - The scan manager window will appear, docked to the right hand side of the screen.
- Click on the authors tab to group scans by concept author.
- Scroll the Scan Manager scroll bar down so that you can see the Darvas scans.
Selecting a Darvas Scan
The Darvas scans listed below are built into BullCharts. The Darvas Box in Progress scan is a good scan to start with when exploring Darvas Boxes.
Broke Darvas Stop in Last 5 Days
This will find all securities that have reached, or pushed below, their Darvas stop-loss level any bar in the last 5 bars.
Broke Darvas Top in Last 5 Days
Searches for securities that have pushed above the top of a Darvas box any time in the last five days. A new box may have since been created.
Darvas Box in Progress
Lists all securities that are currently showing a Darvas box. Note that the security may have moved outside the range of this Darvas box.
First Darvas Box in Progress
Similar to the previous scan, though restricts results to securities that are still at the first box of the series.
Within Darvas Stop Area in Last 5 Days
Finds all securities that have drawn a Darvas box, but at some stage in the last 5 days have pushed into gap between the bottom of the box and the stop-loss price. Note that the security may have since either moved back, or broken the stop level, closing the box.
Running the Scan and Reviewing Results
To search for Darvas boxes, follow these steps:
- Left-click once on the scan you wish to run. For example “Darvas Boxes in Progress”
- Click on the run button at the top of the BullScan Manager
- A scan results window (which is initially mostly white) will appear and the scan will start to run. The scanning progress will appear in the status bar.
- The scan results will now show all securities currently in a Darvas Box. The first shows the ASX code (called Symbol) and the following columns give information about the Darvas box.
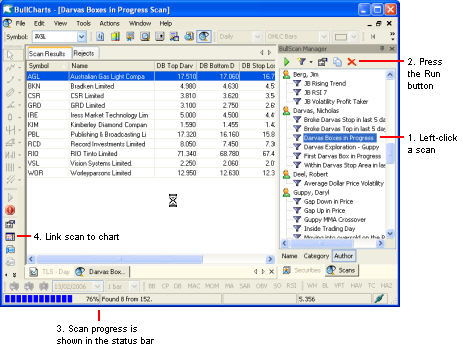
- Press the Link Scan to Chart icon

 to create a chart that will show the results. A new chart window will be created, and the windows will be rearranged so you can see both the scan results and the chart at the same time.
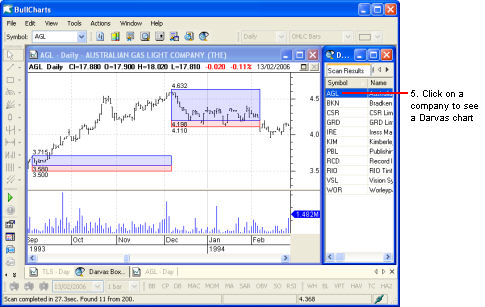
- Note: The Scan Manager window has been closed in this picture.
- Click on each company in the Scan results window to view its chart. Alternatively, use the up and down arrow keys to flip between results. (If the arrow keys don’t work then ensure that you have the scan results window selected)
Darvas Box Properties

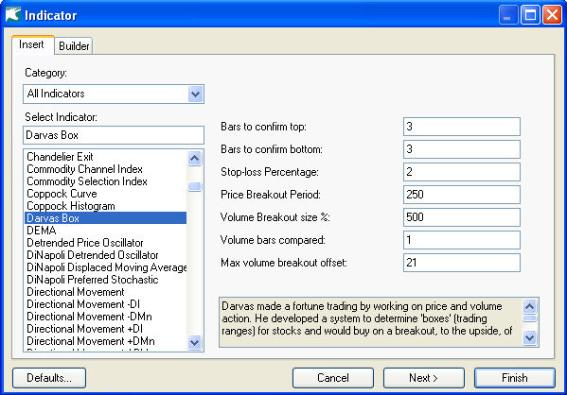
Maximum volume breakout offset means the number of bars to look at. The default value is 21 means that the last 21 bars are analyzed to see whether there is a volume breakout in the selected time period.