Your First Chart
Opening your first chart
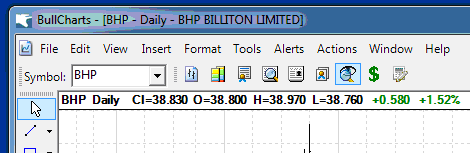
You are able to type the stock symbol in the Symbol Box.
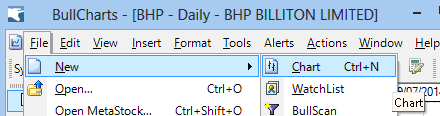
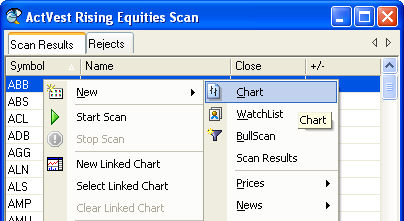
You can also select Chart from the New menu under File. This will prompt you for the name of the stock that you wish to display. You are able to type any stock symbol for equities, warrants and options. A default stock symbol is listed. The most recently viewed stocks will be listed for your convenience. A short cut is CTRL + N to open a new chart window.
Finding the symbol for a particular stock
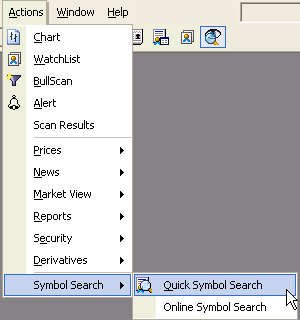
This will allow you to find the symbol for any listed stock on the Australian Stock Exchange. Note: You need to be connected to the Internet to access this feature.
Changing from one stock to another stock
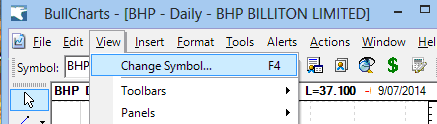
You are able to change the current chart to display another stock symbol. The short cut is to press F4. If you wish to open another window then use the File/New/Chart option.
Overlay a stock on another chart
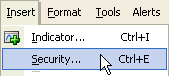
This allows you to overlay or insert a stock or an index.
Insert Relative Strength Comparison
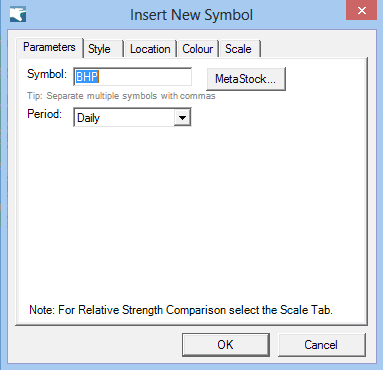
A common strategy is to apply a Relative Strength Comparison. This allows you to create your index for comparison. First, select Insert Security. Next, type the index symbol such as XAO, select Plot Type from the Style Tab, select the Price in the Add to Pane box on the Location Tab and then tick Relative Strength Comparison on the Scale Tab. This will then form a line that combines both the index and the selected price plot.
Indicators
Inserting an Indicator
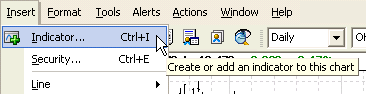
Indicators can easily be applied to your chart.
Overlay Indicators onto a different window or scale
BullCharts has intelligent defaults for where an indicator should be positioned. However you can override the defaults options. When you Insert and indicator, click on the Next button to reveal the properties for the Indicator. The Location tab provides numerous options to add the indicator to a new pane, overlay on the Price Chart, use a different scale.
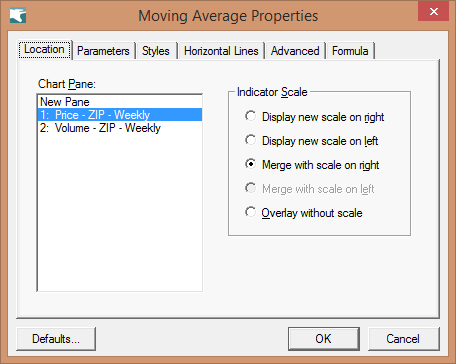
You are able to select different location to insert the indicator.
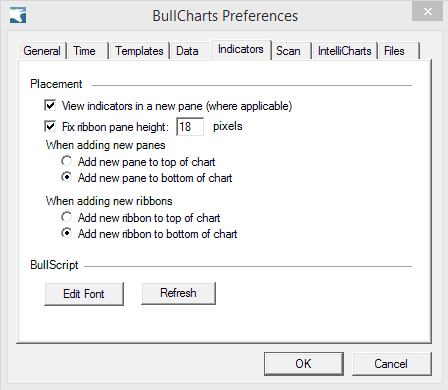
Changing the position of where the indicator is inserted
Intelligent defaults have been set to insert an Indicator in the most appropriate window. For example, Moving Averages, are normally overlaid on the Price Plot window pane. However, the default for other Indicators is to insert a new window pane at top of the window. Some users may prefer to insert new Indicators at the bottom of the window. To change the default position, select Preferences from the Tools menu. Next select the Indicators tab, click the option ‘Add new pane to bottom of chart’, then Apply.
Indicator Toolbar
You are able to create your own list of indicators in Favourites and display then on the Indicator Toolbar. To modify the indicator toolbar, go to Insert then Indicators. Select the Builder Tab. Each Indicator has an option to include on the toolbar.
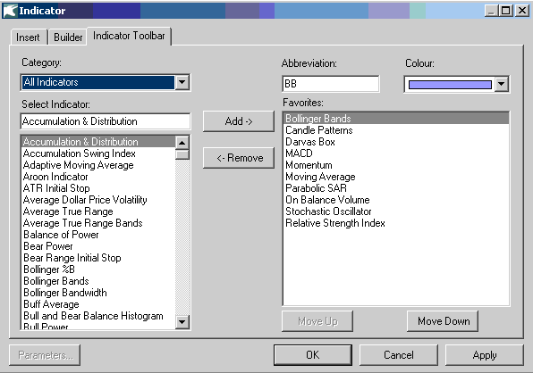
The indicators on the toolbar are part of the category Favourites in your Indicator list.
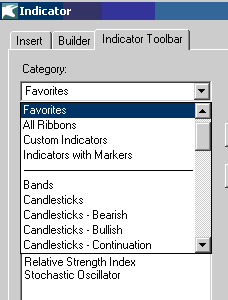
Chart Toolbars
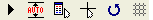
Actions Toolbar
______________________________________________
 Open a New Chart
 Market Depth (If have access to live data)
 Security Details
 Search on individual company News
 NewsDesk
 Security Manager – list of stocks, industry groups, indices
 BullScan Manager
 Portfolio Manager
 Trade Planner
Chart Tools Toolbar – Zooming

These various buttons allow you to zoom in or out of the chart.
 Zoom Box
 Undo Zoom Box
 Zoom In on Timeline
 Zoom Out on Timeline
 Increase top margin
 Decrease top margin
 Decrease bottom margin
 Increase bottom margin
 Go to Start of Chart (Earliest date)
 Go to End of Chart (Most current date)
 Fit the entire chart into one window.
Chart Tools Toolbar – General
 Auto scroll when the you have access to Intraday time intervals
 Auto centre the chart in the window.
 Information Window with details on the position of the current cursor.
 Cross hair
 Repeat the last drawing tool
 Display the grid in the chart
Workspace Toolbar
 Update all windows when symbol is changed
 Update all panes of selected chart when symbol is changed
 Tile Windows
Time Scale
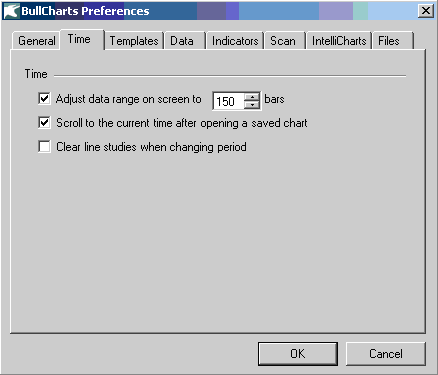
Fix the Time Scale to display a certain time range
You may wish to view a certain time frame such as 6 months, 1 year and so on. This can be controlled in the Time tab in Preferences under the Tools menu. The number of bars relates to the period you have selected. If you have selected Days for frequency, then bars will equal the numbers of days. Similarly with Weekly etc. If, for example, you wish to always display charts with approximately 6 months of daily data, then select 150 bars. This is 150 trading days or approximately 6 months
Using Chart
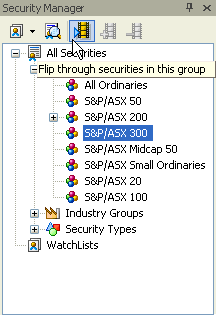
Slide show of a list of stocks or your own watchlist
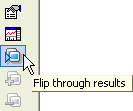
With BullCharts it is easily to automatically flip through a list of stocks. Simply start the Security Manager by pressing F6, then select the list for the slide show. It may be the ASX 300, and industry group or your own watchlist. Next, click on the Slide Show icon.
Templates
For more details on BullCharts’ template system, see Using Templates.
Creating your own template
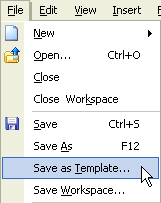
You are able to save a template of your favourite chart including colours, time frame and indicators.
Applying a Template
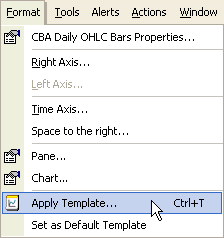
Select any previously saved template, and it will be applied to the current chart.
Saving Trendlines
Your Trendlines are automatically saved as part of the IntelliChart feature. See IntelliCharts In Detail for more details.
Workspaces
Workspaces or layouts are useful to display charts that you regularly look at. A workspace saves a number of charts retaining the layout on screen. When you open the workspace again the same layout is retained. You can arrange your screen with different charts and then select Save Workspaces from the File menu. To open a workspace, simply select Open from the File menu. The workspace name will be shown in the BullCharts title bar.
Changing Colours
Changing colours and styles of the price plot or indicator
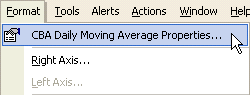
Select the indicator or the price plot and then Format. Here you will find many options to change the appearance.
Changing the colours of the individual panes
A chart is made up of individual window panes divided by a splitter. You can modify the colour of each pane or select the option to apply the colour to all panes.
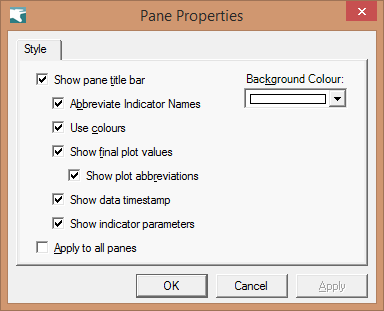
If you wish the background of the whole chart to change, then select Apply to all panes.
Modifying the Chart window
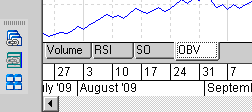
Stacking the Indicator Panes in one pane
A useful feature in BullCharts allows you to stack the indicators into one pane. This helps to focus on the price chart and one indicator at a time. Then you are able to switch back to the normal tiled mode to see all indicators at one time. Press F3 to experiment with this feature.
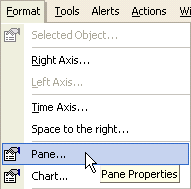
Adding additional horizontal margin for trendline drawing
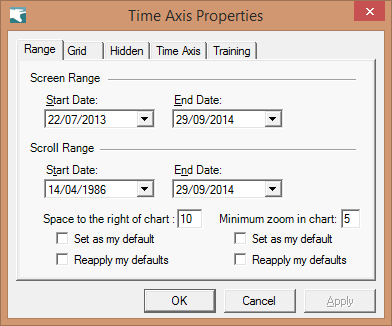
Some users when drawing a trendline require addition right hand margin on the time axis. From the Format menu, select Space to the right…
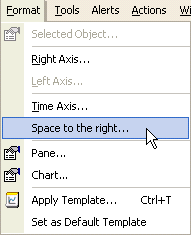
There is also an option Time Axis to add space in number of bars to the right of the time axis.
Adding additional vertical margin
The best way to do this is to disable the Auto Scale option that centres the chart automatically. Click on the Auto Scale button to disable it. Now you able to use the mouse cursor to click on the chart and move in any direction.
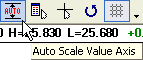
Chart Preferences
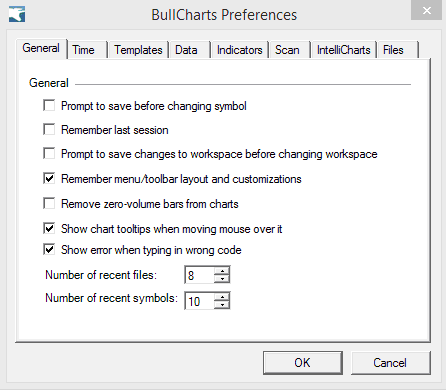
BullCharts has a number of defaults that are found in Preferences under the Tools menu.
General for defaults about promoting for saving and remember last workspace.
Time controls how many data bars are displayed on screen by default.
Templates is an important option for have line studies, trendlines, scale etc are included in the saved template.
Data selects the primary data source, controls automatic prompting to download data and the behaviour of live data.
Indicators to determine if indicators appear on their own pane or on the price chart, and to set the font used for viewing BullScript code.
Scan provides various options to control how a chart gets formatted when it is linked to a scan.
IntelliCharts automatically saves line studies, space to the right for the chart and edits retained for a particular time period.
Files provides a link to all the major user files such as templates, IntelliCharts, custom scans, indicators and watchlists.
Your First Scan
The following is a brief introduction. For more information see the next section, as well as BullScan Manager. With BullScan you are able to use many of the built-in scans or create your own. Also you can scan on the entire market, just an Index like the ASX 200 or Industry Sector. You can also create your own custom watchlist to scan on.
Running your first scan…
BullScan is a very powerful search engine to identify opportunities in the market place. To start BullScan, select Actions, then BullScan. Alternatively, press F8.
To run a built-in scan select any in the list and then Run from the BullScan Manager.
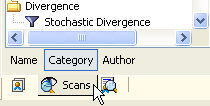
You are able to sort the list of scans by Name, Category or Author. As an example, click on the Name tab at the bottom of the BullScan Manager
Next select the 1 Day Surge Volume. Then click Run in the menu.
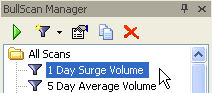
This will list the top 100 stocks by volume.
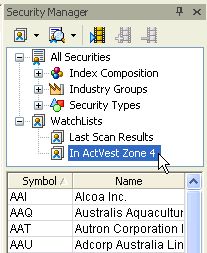
This particular scan result window shows stocks that fall into the Alan Hulls Zone 4
Using BullScan
 New
New
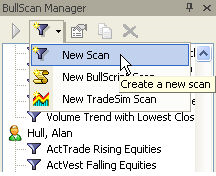
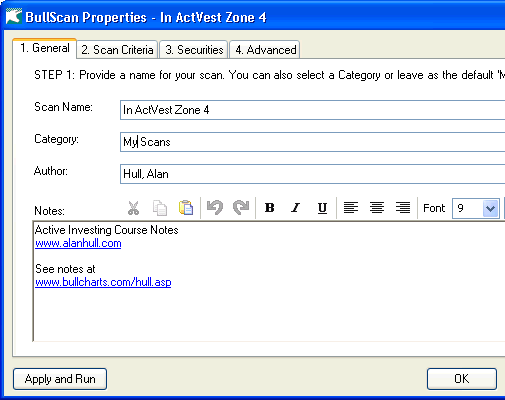
To create your own scan, fist click on New. Your new scan will be saved in the BullScan manager folder called My Scans.

 Editing a scan
To edit a scan, select the scan, then Edit from the menu. Many examples are provided. You will then see the filters that are used to create the scan. You can modify the options to suit your trading strategies.
 Copy
Copy
Use this function if you wish to copy another scan as a basis for making your own scan.
 Delete
To delete an existing scan.
Saving a scan
The scan is saved when you click the Apply button or the OK button. The scans are stored in the Scan directory when you installed BullCharts. Any new scans that you create will appear in the My Scans folder of the BullScan Manager.
Changing the folder for scan
The scans are stored according to the category name in the General tab of a scan. You can change the folder by simply changing the name of the category and then clicking Apply..
Opening a chart from your Scan list
Double click on the stock and the chart will appear on the left.
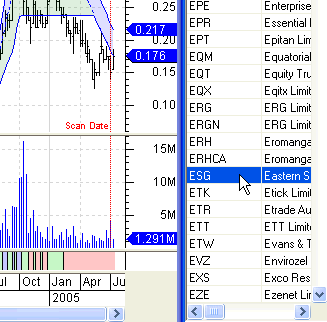
You can then use the up/down cursor to scroll through the list. Alternatively, you can access other modules such as Prices, News or Security Details by using the right-hand button on the mouse.
Slide Show
If you can activate the auto slide show to flip through the charts one by one.
Scanning only the ASX 200 or a Sector
It is possible to scan on just an Index Group or a Sector or your own custom list in a WatchList. Select the Scan you wish to modify. (You may wish to make a copy first.). Select Ordinaries and then Remove. Then select S&P/ASX 200 from the Index Composition list and then Add.


Create your own WatchList for scanning or charting
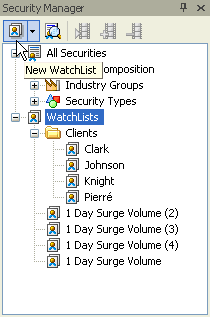
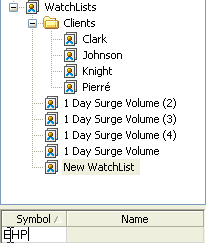
To create a watchlist for scanning or charting, select Security Manager from the Tools menu or F6 to open. Then select New WatchList icon.
Next, select the row in the bottom panel to enter your stocks.
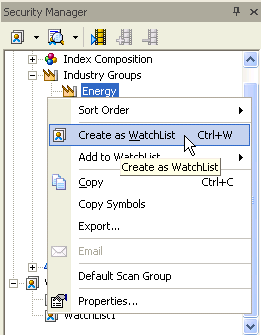
Creating a WatchList from an Index or Industry Group
Select the Index or Industry group then from the Edit menu select Create As WatchList. Alternatively, you can use the right-hand mouse button.
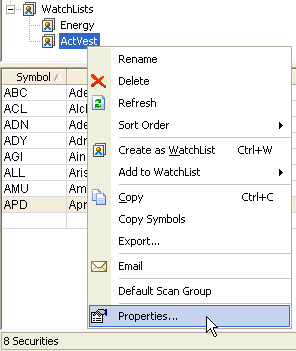
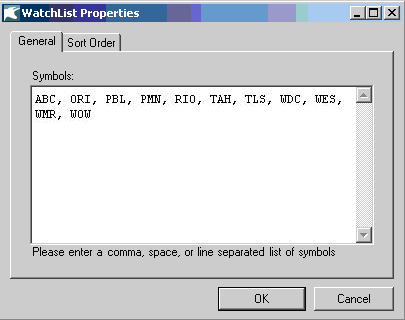
Importing list of stocks into a WatchList
You can import a list of stocks from another program by simply cut and paste the list of stocks. Select the WatchList, then click the right hand mouse and select Properties. This will open a dialog box to paste your stocks in to. The stock symbols should be separated by a spaces or commas.
Online WatchList
There are two types of WatchLists in BullCharts. The first type is the WatchList that you create in the Securities Manager for flipping through charts and scanning on a selected list of securities. The other is the Portfolio WatchList that is used to record your share holdings and view news and other reports for your stocks.
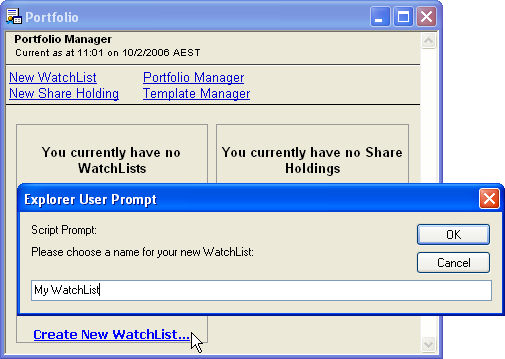
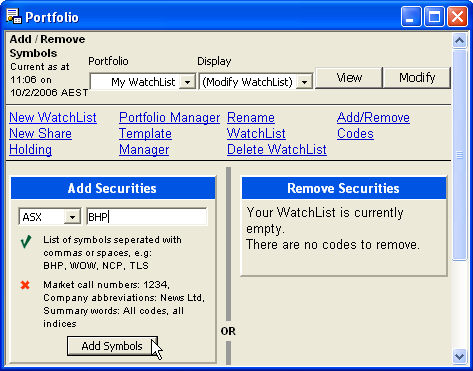
Creating a Portfolio WatchList
From the Actions menu, select Prices then Portfolio. You will have a message that you have no WatchLists. Select Create New WatchList.
Adding stocks
Type in the stock securities that you wish to add.
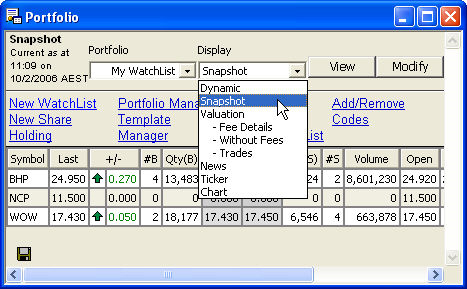
Viewing a watchlist
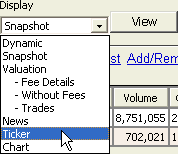
Select Dynamic or Snapshot. Dynamic is available to members on the live data plan. The data will update continuously. Snapshot will provide an update either live or end of day depending on the data subscription plan that you are on.
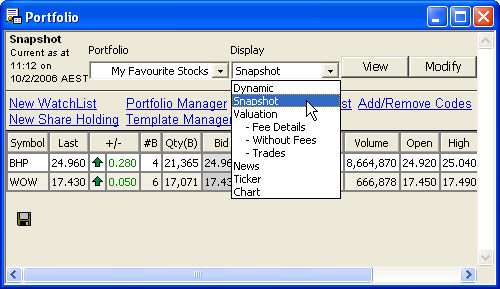
Opening a chart from a watchlist
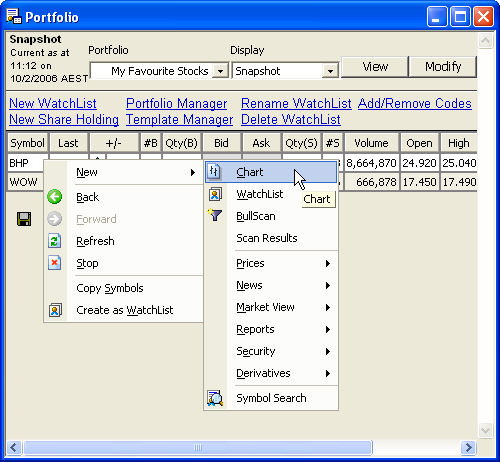
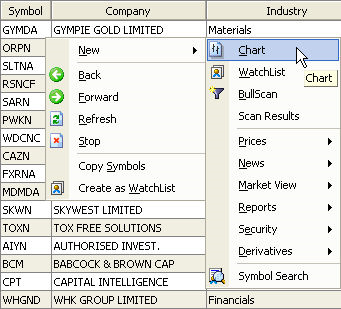
When you have created a watchlist in your Portfolio, you are able to open a chart from the list. To do this first select your Portfolio, then Snapshot, then click View.
Then mouse your mouse cursor over the top of the stock that you wish to chart then click the right hand mouse button. Select New, then Chart.
Alarms
If on a Live data plan, the Ticker option in Portfolio provides an alarm or alert function. Create a watchlist first, and then select the watchlist from the Portfolio list. Next select Ticker from the View list, then click on the View button.
Select Alarm to view the properties.
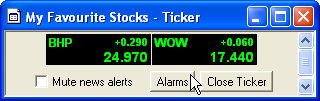
Type the symbol to set the alert on and the trigger options.
Market View
Opening a chart from a report
From many reports, you can open a chart using the context menu. Position the mouse cursor over the stock symbol you wish to chart, click the right hand mouse button, select New and then Chart.
Updating Your Data
Daily Data
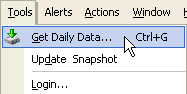
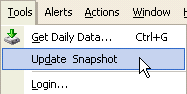
You are able to update or download your daily data from the Tools or by pressing Ctrl+G on your keyboard.
BullCharts automatically monitors what data you have downloaded. When you start BullCharts it will advise you what dates to download since your last update. This is convenient feature when you are absent from your computer or on holidays.
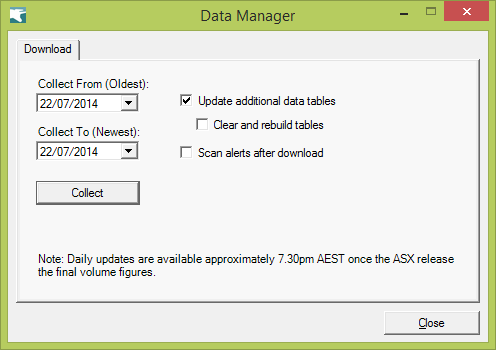
Snapshot Intraday Data
BullCharts supports intraday snapshots for Live, Intraday and End of Day plans. This allows you to update your chart with the last data point from the snapshot as well as scanning on intraday data.
Live allows you to view charts live with continuous updates. You are also able to download data live to then do a scan. You are able to update the snapshot with live data every 10 minutes. When you run the scan, BullCharts checks to see how long it has been since you last downloaded a live snapshot. If the last snapshot is more than ten minutes old (configurable in the BullCharts preferences), you will be asked if you want to download a fresh snapshot.
You can also manually download a live snapshot by selecting “Update Snapshot” from the tools menu. Note that there is a restriction on how frequently you can download snapshots. Then you will then need to update your daily data after 7.30pm using the Get Daily Data option to complete your historical data.
Intraday 20 minute delayed data allows you to download a 20 minute delayed snapshot at 11.20am, 12.20am, 1.20pm, 2.20pm, 3.20pm and 5pm. The data is 20 minutes delayed, so for example the 11.20am snapshot is data current as at 11.00am. The charts will update and show an intraday last data point to match the snapshot data. Further, in BullScan you will be able to scan on snapshot data once you have selected the ‘Use Snapshot’ option on the Criteria tab on your scan. Then you will then need to update your daily data after 7.30pm using the Get Daily Data option to complete your historical data.
End of Day allows you to download one intraday snapshot at 5pm. Then you will then need to update your daily data after 7.30pm using the Get Daily Data option to complete your historical data.
Troubleshooting
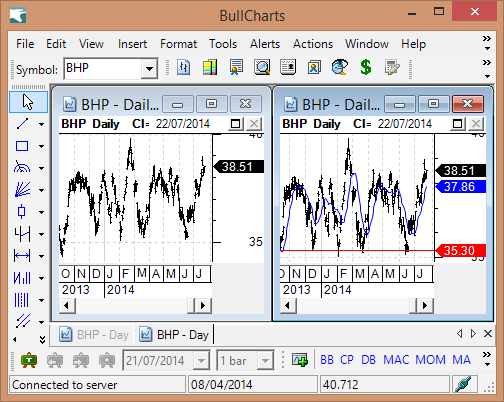
Why are all charts the same stock symbol?
The Synchronise windows button is enabled.
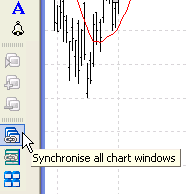
Click the Synchronize windows button to disable it.