Overview
Different users have different expectations, and use BullCharts in different ways. Although BullCharts initial configuration should work reasonably well for most users, you can use the BullCharts Preferences dialog to customise how BullCharts behaves in certain situations.
How to find the Preferences dialog
To open the Preferences dialog, open the Tools menu then select “Preferences”.
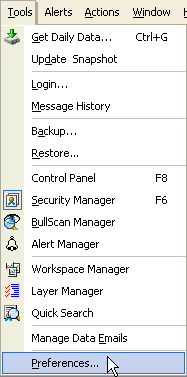
The Preferences dialog should appear.
Preferences
General Preferences
The General preferences tab allows you change the behaviour of the BullCharts interface.
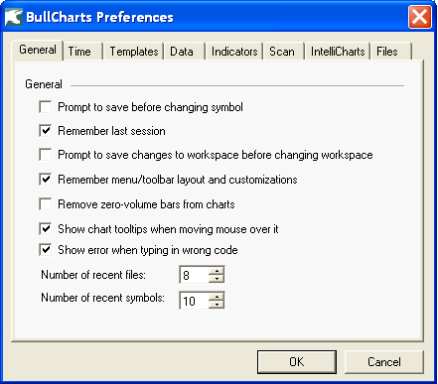
Prompt to save before changing symbol: If this box is ticked and you have a chart active, then when you change the chart’s symbol (by typing a new symbol in the “Symbol” box in the toolbar) you will be given the choice of saving the current state of the chart.
Remember last session: If this box is ticked, then any windows you have open when you close BullCharts will be reopened when you next open BullCharts, even if “Prompt to save charts before closing” is unchecked, or you chose to discard some.
Remember menu/toolbar layout and customisation: BullCharts allows you to add and remove commands from menus and toolbars, and rearrange toolbars on the screen. However, if you delete an important command or an entire toolbar, you can untick this box and restart BullCharts to reset the menus and toolbars to their defaults.
Remove zero-volume bars from charts: When plotting a chart, BullCharts can automatically skip over samples (days in a daily chart, weeks in a weekly chart, and so forth) where no trades have occurred. This eliminates gaps in the chart caused by public holidays and other non-trading days, but it can cause infrequently-traded securities to display misleadingly crowded charts. When using this option, remember to examine the time axis for any unexpected abridgements.
Show chart tooltips when moving mouse over it: When moving your mouse over a chart, the chart tooltips will appear. However, if you do not want to display the tooptips, you can untick this box.
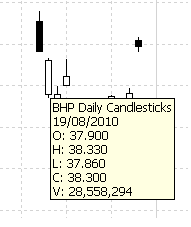
Chart tooltips
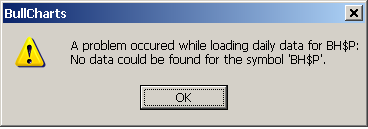
Show error when typing in wrong code: Untick this box to disable the error message.
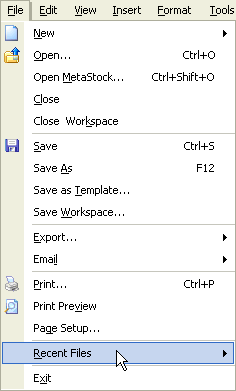
Number of recent files: Files you have recently opened or saved are listed in the ‘Recent Files’ section at the bottom of the File menu, so you can quickly return to them later. This control allows you to choose how many recent files will be remembered in the ‘Recent Files’ section.
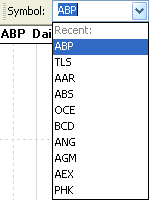
Number of recent symbols: Every time you enter a symbol in the “Symbol” box in the toolbar, it is remembered in the Recent Symbols list. This control allows you to choose how many symbols are displayed in the Recent Symbols list.
Time Preferences
The Time tab allows you to customise how BullCharts behaves when the time axis changes.
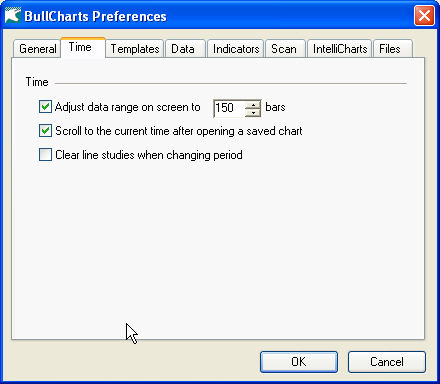
Adjust data range on screen to … bars: When BullCharts adjusts the chart’s zoom, it tries to ensure that this number of bars will fit on the screen. If there isn’t enough data to fill this number of bars, BullCharts will zoom to fit all the data. Note that this number is not used directly for non-linear-time plots such as Gann Swing: each Gann Swing bar is about three times as wide as a regular bar, so when you change the period of a Gann Swing chart, BullCharts will zoom in or out to try and display a third of this many bars.
Scroll to the current time after opening a saved chart: If this box is ticked when you open a chart, BullCharts will automatically scroll the chart so that the today’s data is visible. If this box is not ticked, BullCharts will leave the chart where it was.
For example, say you save a chart on June 30th that is showing the previous month’s data (that is, all of June), and then open that chart again on July 30th. If this box is ticked, then when you open the chart, it will show the data for July 30th and the previous month’s data (that is, all of July). If this box is not ticked when you open the chart, it will still show the data for June 30th and the previous month’s data (that is, all of June), but you will be able to scroll right to see July’s data.
If you always want to see the latest information for a stock, tick this box. If you occasionally want to examine historical data and you want BullCharts to remember where you were working last, untick this box.
Clear line studies when changing period: If this box is ticked, then changing the chart’s period will remove any line-studies and drawing tools that have been placed on the chart. Since a chart’s shape can change substantially as you adjust the chart’s period, line-studies can be less useful on a chart whose current period is different from its original period.
Templates Preferences
The Templates tab allows you to choose which information BullCharts regards as part of a template, and which information is not.
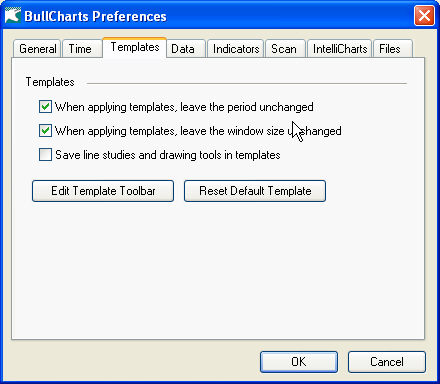
When applying templates, leave the period unchanged: If this box is ticked, then applying a template to a chart leaves the chart period (Daily, Weekly, etc) alone. Otherwise, the chart’s period is set to the template’s period.
When applying templates: leave the window size unchanged: If this box is ticked, them applying a template to a chart does not change the chart’s size. Otherwise, the chart’s size is set to the template’s size. Note: This only affects the chart’s size when it is not maximised.
Save line studies and drawing tools in templates: If this box is ticked, then newly saved templates will include any line-studies and drawing tools in the original chart, and hence applying those templates to a new chart will add the original line-studies and templates to the new chart. Since line studies and drawing tools on a chart tend to only be meaningful in relation to the specific security on the original chart, including them on any other chart is likely to be pointless.
Edit Template Toolbar: This allows you to add/modify/delete templates from the templates toolbar for quick and easy opening of templates whose abbreviations are displayed in the template toolbar. As templates can be saved as files in any location, the Template Toolbar allows you to easily access these templates from a central location in BullCharts.
Reset Default Template: If you have changed the BullCharts default template (by right-clicking on a chart and choosing “Set as Default Template”, this button allows you to set the default template back to its factory defaults.
Data Preferences
The Data tab allows you to configure the means by which BullCharts gets security-price data, as well as enabling dynamic updates for various chart types.
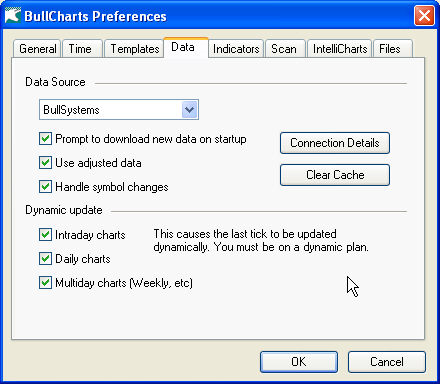
- Data Source: This list contains all the sources for price data that BullCharts knows about. The demo version of BullCharts can only use the BullSystems data feed. Once you have activated BullCharts you can also select the MetaStock data source and specify a MetaStock directory. BullCharts does not, however, update the MetaStock data.
- Prompt to download new data on startup: When ticked, BullCharts will automatically check for new data each time it is started. If new data is available, then you will be asked if you want to download it.
- Use adjusted data: When ticked, adjusted data is used for charts and scans. Data may be adjusted to account for splits, consolidations, or other corporate actions. If not ticked, unadjusted data is used.
- Handle symbol changes: When ticked, BullCharts will check to see if the company being charted has previously traded under a different ASX code. If it has, then entering the new ASX code will cause data to be loaded for both the new code and the old code. Data for the old code appears in a different colour.
- Connection Details: Clicking this button allows you to configure how BullCharts connects to the selected data source. This might include such details as the user name and password you use to connect to the data source, the location of the data server, and so forth.
- Clear Cache: When you view intraday data for a security, BullCharts downloads only the data for that security (since downloading intraday data for every security would take a very long time and consume a very large amount of disk space). Even if the intraday data has been updated since you last downloaded it, it will not be downloaded again. To see the most accurate intraday data, click this button and then view an intraday chart. Note: This data does not delete any daily data.
- Dynamic Update: If the current data source allows access to dynamic, live data (BullSystems only allows dynamic data on the higher plans), you can choose whether or not BullCharts should dynamically update the last tick on the price chart to reflect the live stock price. However, updating the final point can cause any indicators on the chart to be recalculated: if you enable dynamic updating on a chart of a volatile stock, and you use a lot of indicators or have a slow computer, BullCharts could become uncomfortably slow.
- Intraday chart: Load dynamic data for intraday charts. That is, charts with a time period of less than (but not including) one day. For example, hourly charts.
- Daily chart: Loads dynamic data for daily charts. This is presented by showing an extra bar on the chart that is updated live to represent the current day.
- Multiday charts: Loads dynamic data for charts with a period of greater than one day. For example, weekly charts. When this option is selected, the last bar is an aggregate of all trading days for the period so far, including the current day in progress. It is updated live as trades occur on the current day.
Indicators Preferences
The Indicators tab allows you to change various settings that affect how indicators are inserted into a chart.
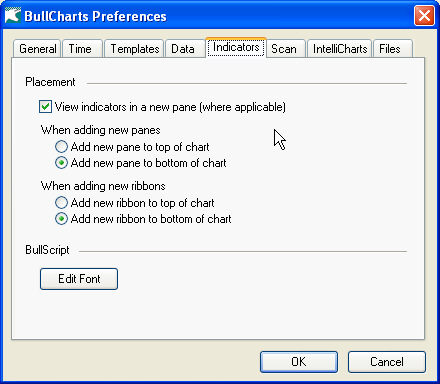
View indicators in a new pane (where applicable): Some indicators are most meaningful when displayed on a particular axis, such as the Price or Volume axis. Such indicators will always be added to the Price or Volume panes respectively. If this box is ticked, other indicators will each be added to a new pane, otherwise they will be added to the Price pane.
When adding new panes:
- “Add new pane to top of chart” causes new panes to be inserted above the top pane of the chart.
- “Add new pane to bottom of chart” causes new panes to be inserted below the bottom pane of the chart (but above the Time Axis, if that is below the bottom pane).
- This applies to new panes added to hold indicators, as well as new panes added with the “New Pane” item in the context menu. It does not apply to new ribbon panes. After a pane has been added you can move it to any location in the chart by right-clicking on the pane and choosing the “Move Pane” item.
When adding new ribbons:
- “Add new ribbon to top of chart” causes new ribbons to be inserted above the top pane of the chart.
- “Add new ribbon to bottom chart” causes new ribbons to be inserted below the bottom pane of the chart (but above the Time Axis, if that is below the bottom pane).
- This applies to all ribbon indicators. After a ribbon has been added, you can move it to any location in the chart by right-clicking on the ribbon and choosing the “Move Pane” item.
BullScript
Edit Font: Allows you to change the default font for when viewing BullScript.
Scan Preferences
The Scan tab provides a number of options that control how a chart is linked to a scan. When a chart is linked to a scan, it can load various settings an indicators based either on your default chart template, or on the scan being linked.
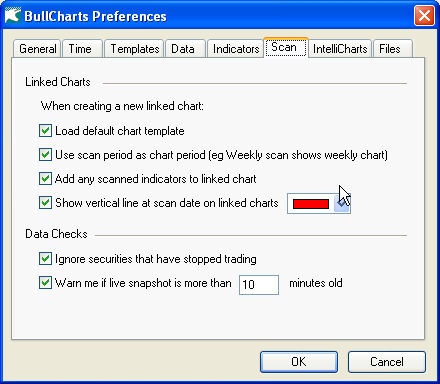
Load default chart template: Causes the default chart template to be loaded when linking a scan to a chart. This will also include any colours and indicators from the chart template.
Use scan period as chart period: Adjusts the time period of the linked chart to match the scan being linked. For example, if the default chart template is for a daily chart, but the scan is being performed on weekly data, then the linked chart will appear as a weekly chart if this option is checked.
Add any scanned indicators to linked chart: When ticked, BullCharts will examine the criteria used in the scan and if any indicators are being scanned then they will be added to the chart. Note: This is in addition to any indicators that are on the default chart template (if being used).
Show vertical line at scan data on linked chart: Displays a vertical line (in the selected colour) on the date that the scan applied to. This helps recognising why the scan has selected a particular security, particularly if live data is being charted (but not scanned) or if a scan date other than the latest is being used.
Data Checks
Ignore securities that have stopped trading: Assists in scanning to remove any stock that has no current data. Recommended to be used in conjunction with Remove zero-volume bars (on the General Tab) from the chart for scanning purposes. Note: It is difficult to determine if a stock has stopped trading.
Warn me if live snapshot is more than…: For those on the Live data plan. It will warn you when the data is out of date.
IntelliCharts Preferences
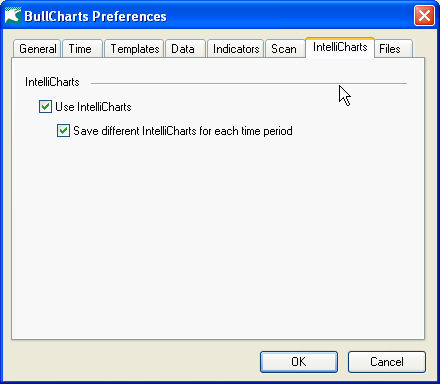
Use IntelliCharts will retain lines studies, etc. for a period chart. This option is on by default.
Save different IntelliCharts for each time period when selected, allows any line study to be applied to individual time periods. For example, you can draw a particular trendline for a daily chart and then a different trendline for a weekly chart. This option is off by default.
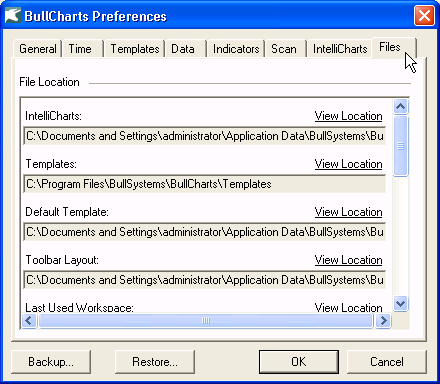
Files
File location of all the major user files such as IntelliCharts, Default Template, Last Used Workspace, Template Folder, Custom Indicators, Custom Scans, WatchList, BullCharts Log.