Overview
Derivatives reports contain information on Exchange Traded Options and Warrants. Such information includes a listing of all the available contracts, pricing, and details on each contract.
Starting Derivatives
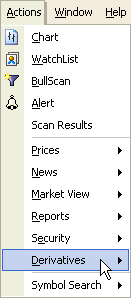
To access Derivatives, point to Derivatives on the Actions menu.
Available Reports
Available reports are described in the following table:
| This | Means |
|---|---|
| Options Report | A summary of all the Exchange Traded Options available over a particular security, organised by expiry date |
| Warrants Report | A summary of all the warrants available over a particular security, organised by expiry date |
| Covered Calls (ITM) | Covered calls – In the Money |
| Covered Calls (OTM) | Covered Calls – Out of the Money |
| Options Calculator | Options Calculator with the Greeks |
Options Report
The Options Report lists all of the exchange traded options available over a particular stock. It displays these options organised by expiry date. To launch an options report, type the symbol of the underlying security in the Symbol field on the Quote toolbar, then point to Derivatives on the Actions menu, then click Options Report.
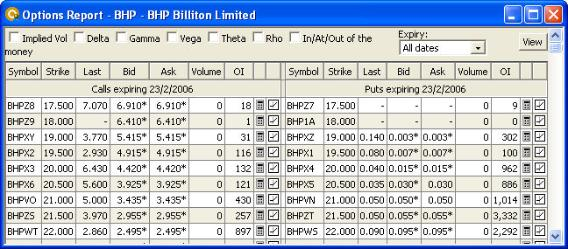
Options Report
* Some bid and ask prices are marked with an asterisk. This indicates that there are currently no bids or asks for that particular option, so the last existing bid or ask price is being displayed instead.
Warrants Report
The Warrants Report lists all of the warrants available over a particular stock. It displays these warrants organised by expiry date. To launch a warrants report, type the symbol of the underlying security in the Symbol field on the Quote toolbar, then point to Derivatives on the Actions menu, then click Warrants Report.
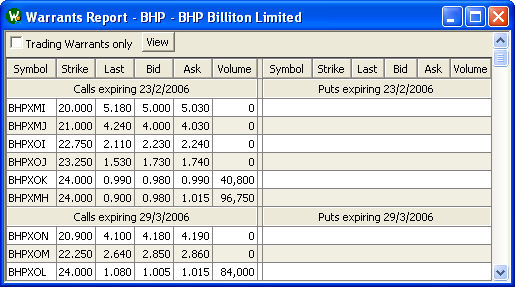
Warrants Report
Covered Calls (ITM)

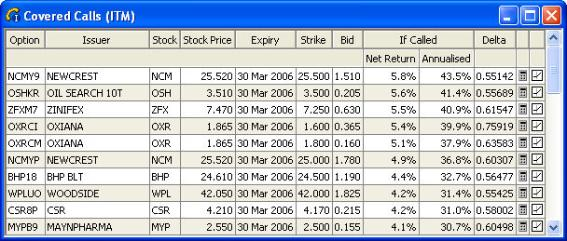
Covered Calls (ITM)
Covered Calls (OTM)
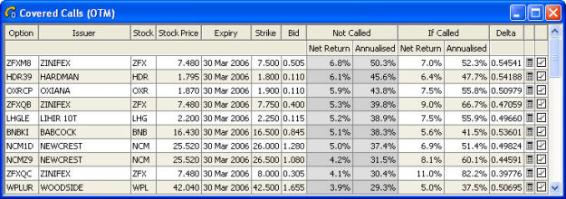
Covered Calls (OTM)
Options Calculator
Provides calculations for Implied Volatility and “The Greeks” including Delta, Gamma, Vega, Theta and Rho.
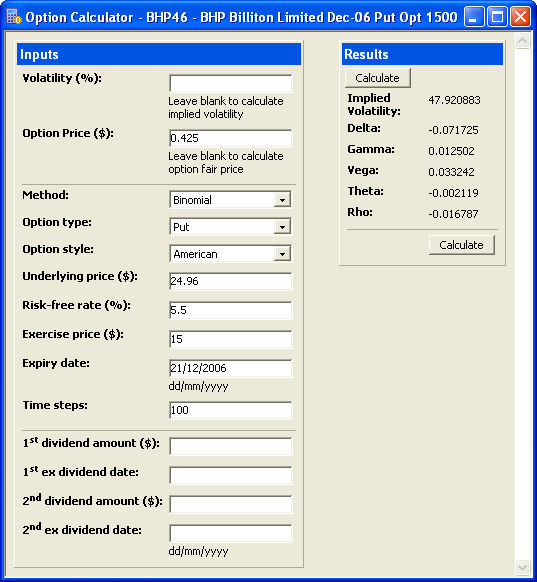
Options Calculator
Payoff Diagram
BullCharts allows you to display payoff diagrams to show the potential profit or loss on your strategy at different stock prices on expiry.
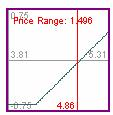
Payoff Diagram