Overview
The Market View collection of reports is designed to aid your understanding of the condition of the market. Reports available include a list of upcoming dividends payable, recent and upcoming floats, as well as a market summary which shows trading volumes and value by sector.
Available reports:
- Market Scan is a powerful scanning tool to find stocks matching selected criteria. See Chapter 15: Market Scan for more details.
- Indices shows all the standard ASX indices
- 52 Week High/Low lists of all stocks that have made new 52 week highs or lows.
- Pre-Open Alert provides a list of symbols whose buy price is most above their previous closing price.
- Market Summary lists information on market activity during the current trading day.
- Market History lists historical daily market activity information.
- Advances/Declines shows the number of securities that have advanced in price, declined in price, or were unchanged during the current day
- Market Map is a graphical tool that indicates price movement as well as volume, sales, trades or market capitalisation over the entire market.
- Market Scatter is a graphical tool that plots all of the securities in the market. You can select any two values (such as prices or fundamentals). Each security appears as a coloured point on the chart, with its location depending on the two values. One value is used as the X-axis and the other is used as the Y-axis. For some values a log scale will automatically be used. Security information can be seen by hovering the mouse over a point, or clicking on it. The colour of points can also be used to represent information such as industry group or price movement. Use the Market Scatter to visually search for companies with strong fundamentals, or to compare the relationships between different values.
- Market Pyramid is a graphical tool that indicates the industry sub-groups that have experienced the greatest price movement today.
- GICS Sectors lists the best securities in each industry group
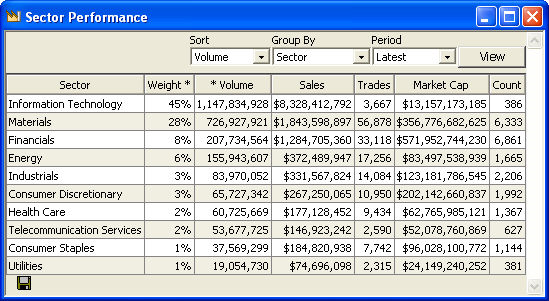
- Sector Performance is for top down analysis by listing the best sectors in the market. It is possible to drill down and list the best stocks in each sector.
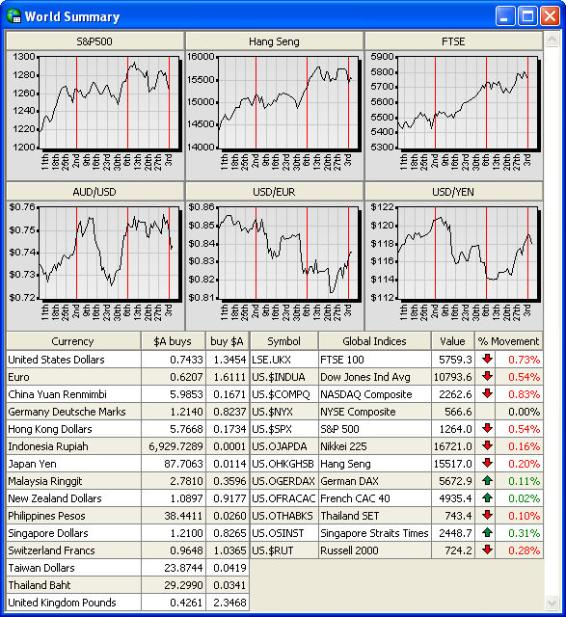
- World Summary summarises international indices and exchange rates.
- World Indices shows several indices from various exchanges around the world.
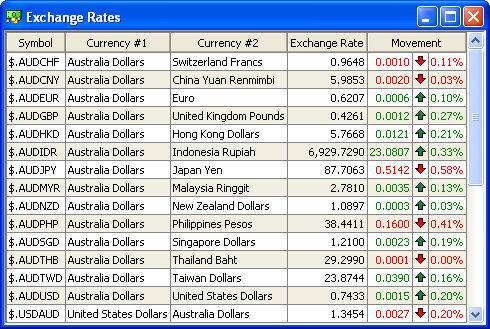
- Exchange Rates shows end of day exchange rates and rate movements for the most common currency pairs.
- Cross Rates shows end of day international cross rates for a wide range of currencies.
Opening Market View Reports
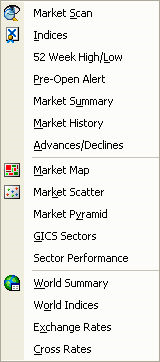
To open a Market View report, go to the Actions menu, choose “Market View” and then choose the report you wish to view.
Market Scan
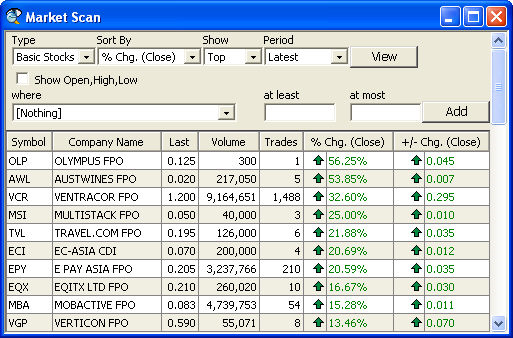
 The Market Scan is a powerful way of searching the entire market for stocks that meet your particular criteria. For a full description of the Market Scan report and how to use it most effectively, see the chapter “Market Scan” later in this document.
Market Map
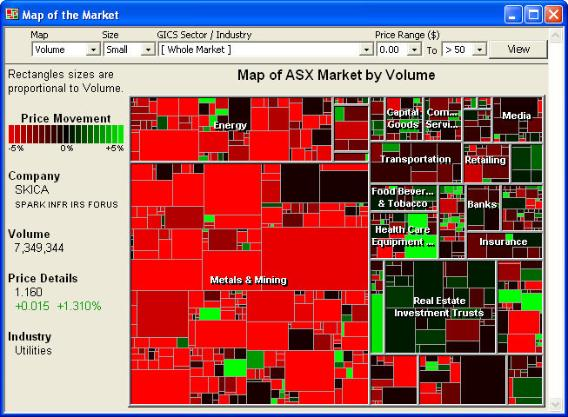
 The Market Map is a graphical tool that indicates price movement as well as one other piece of data from volume, sales, trades or market capitalisation over the entire market. The Market Map is comprised of rectangular cells of various sizes, each representing an individual company or industry sector.

Cell Colour
The colour of each company cell refers to today’s price movement from the previous close. If a company’s cell is green, the price has increased, if it is red, the price has decreased. The brightness of the colour indicates the size of the price movement. Brighter greens and reds indicate large movements, whereas darker colours indicate small movements.
Cell Size
The size of each cell represents the second piece of data selected. This can be volume, sales, trades or market capitalisation. By default volume is used, so the larger the cell for a particular company, the greater the volume of its stock traded today.
Changing the data displayed
The data displayed in the Market Map can be changed using the drop-down menus at the top of the Market Map window. To update the market map based on any changes specified, click the “View” button, and the market map will be refreshed.

Map allows you to choose the data that will determine the cell size. This is Volume (of units traded) by default, but can be changed to Sales, Trades or Market Capitalisation.
Size sets the size of the Market Map. You have the choice of small or large. If you have a small screen or you want to see many windows at once, choose Small. If you have a large screen or you want to seen fine detail, choose Large.
Industry Group allows you to restrict the market map to a particular industry group. The map for that industry group is then enlarged to the same size as the full market map, so more detail can be seen on that industry.
Price Range allows you to restrict the securities displayed to a certain price range.
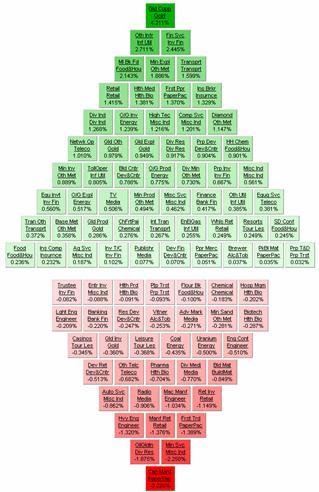
Market Pyramid
The Market Pyramid is made up of cells that represent industry sub groups. The cells are colour coded either green or red, and compiled into a pyramid that indicates the industry sub groups that have experienced the greatest price movement today. The sub-groups at the top and bottom of the pyramid are represented in the darkest colours and have experienced the greatest price movement. The ones in the centre are represented in lighter colours, and have experienced smaller price movements.
On each cell is listed the industry sub-group represented by the cell, and below that, the main industry group to which it belongs. Also listed is the average percentage movement of all the securities in that sub-group.
Changing the data displayed
You can choose whether to view Australian or US securities, whether to view industry movements or view securities in an industry, and what kind of securities to view. When you have adjusted the controls, click “View” to redraw the Market Pyramid with the new information.

Exchange lets you choose whether to view Australian (“ASX”) or US securities.
GICS Sector/Industry allows you to choose whether you view the market as a whole or particular industry. If you choose “Whole Market”, you will see the average movement of each industry.
Type allows you to choose what kinds of stocks will be included in the Market Pyramid: stocks, options, warrants, or everything.
Zooming in on the pyramid
You can zoom in on the market pyramid to view more detail on particular industry groups.
To zoom in on the pyramid to view one industry group only, select the group name from the “GICS Sector/Industry” list, or click the name of the industry group on one of the cells.
If you wish to view a market pyramid of an industry sub-group, click the name of the sub-group on one of the cells.
52 Week High/Low
The 52 Week High/Low report lists all stocks that have made new 52 week highs or lows during today and the previous four trading days.
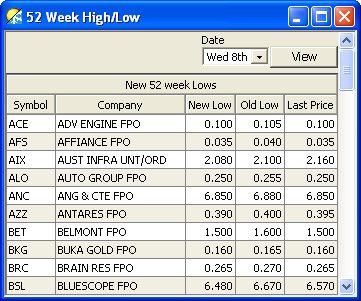
You can view the new 52-week highs and lows for any day in the past week by choosing the date from the “Date” list then clicking View.
Pre-Open Alert
The Pre-Open Alert provides a list of symbols whose Indicative Price is most above their previous closing price. This is useful before the market opens, as it indicates stocks whose prices are likely to increase dramatically when the market opens.
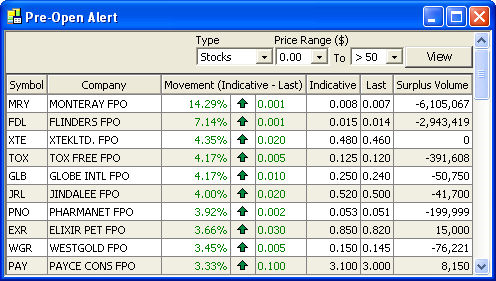
You can limit the securities displayed to particular security types or to securities within a certain price range.
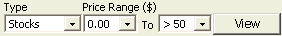
Type lets you choose what kind of securities you wish to view – Stocks, Options, Warrants, or Everything.
Price Range lets you limit the list of securities to ones whose prices (in dollars) are within the given range.
Market Summary
The Market Summary report shows information on market activity during the current trading day. It is organised into four different sections, including a market overview, as well as volume, value and trades information.
Market Overview
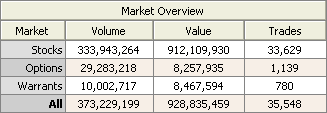
The Market Overview section shows the volume, value and number of trades that have occurred in the market over the current trading day. It is divided into sections for stocks, options and warrants in order to show the activity within these security types. Also shown is a sum of all above data, which indicates total activity on the market for all three of these security types.
Volume
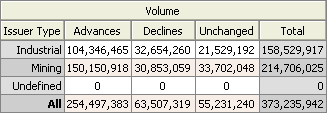
The volume section shows the total volume of the advances and declines. The data is broken down into three issuer types, industrial, mining and other. Also shown is the sum of this data, indicating the total volume traded market-wide, and the total volume of advances and declines over the entire market.
Value
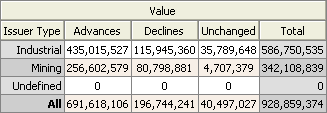
The value section is similar to the volume section, but gives the value of the advances and declines rather than the volume. Like the volume section, the data is broken down into three issuer types: industrial, mining and other. Also shown is the sum of these values, showing the total value traded market-wide, and the value of advances and declines over the entire market.
Trades
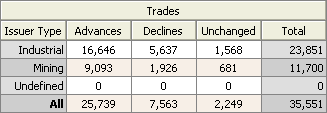
The trades sections gives the number of trades that have occurred in advancing and declining securities, as well as the number or trades that have occurred market-wide. Like the other sections, the data is broken down into three issuer types, and the sum of these is provided to show totals.
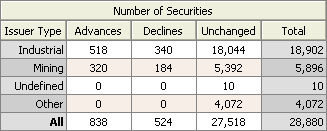
Number of Securities
The number of securities section gives the number of securities whose prices have advanced, declined, or not changed at all. Like the other sections, the data is broken down into three issuer types, and the sum of these is provided to show totals.
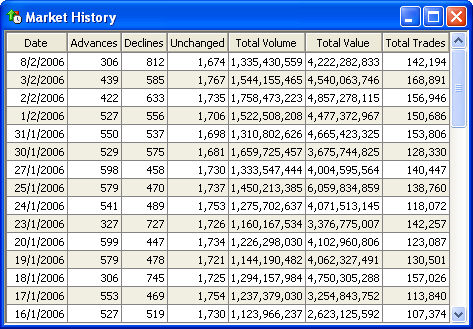
Market History
The Market History report shows historical daily market activity information. This includes the number of advances, declines and unchanged securities, as well as total volume, value and trades data.
Advances/Declines
The Advances/Declines report lists the number of securities that have advanced in price, declined in price, or were unchanged during a particular period. The figures are broken down into three security types: stocks, options and warrants.
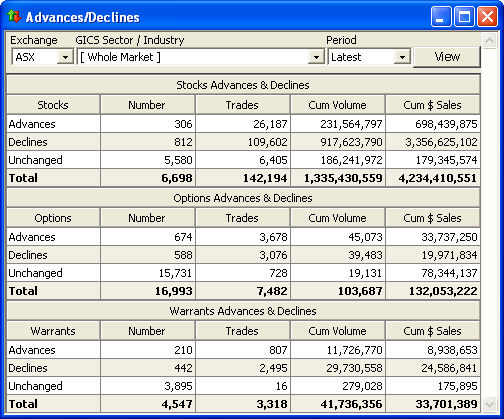
You can also limit the data displayed to particular industry groups, and view data for the various time frames. When you have finished adjusting the controls, click “View” to refresh the information.

Exchange allows you to choose to view advances and declines for Australian securities (“ASX”) or for US securities.
GICS Sector/Industry allows you to show advances and declines for the whole market, or just for a particular industry or sub-industry.
- Period allows you to show advances and declines for any of several periods:
- Latest shows the advances and declines since today’s market open.
- Previous shows the advances and declines for the previous trading day.
- Five Days shows the advances and declines over the previous 5 trading days.
- Last Week shows the advances and declines over the previous calendar week.
- Last Month shows the advances and declines over the previous calendar month.
- Dates lists the previous five trading days. Choosing the first date is equivalent to “Latest”. Choosing the second date is equivalent to “Previous”. Choosing any of the other three dates displays the advances and declines for that date.
GICS Sectors
The GICS Sectors report lists the securities in each industry group. It also shows price and trading information for each of those securities. It is useful in either gaining a list of the companies within a sector, or for determining the largest movers within a sector during the current or previous trading days.

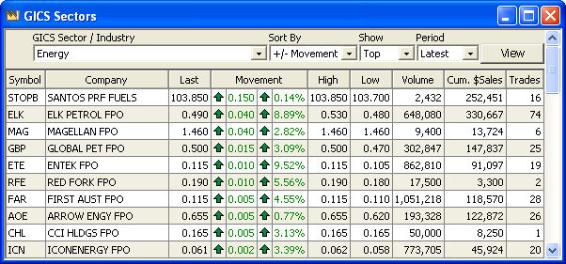
You can choose which exchange to view, which industry to view, and the period for which stock prices are shown. When you have finished adjusting the controls, click “View” to refresh the information.
GICS Sector/Industry allows you to show advances and declines for the whole market, or just for a particular industry or sub-industry.
Sort by allows you to sort of movement, last price etc. Use to find the best stocks in sector.
Show allows you to sort of ascending or descending.
Period allows you to show price changes for any of several periods:
- Latest shows the advances and declines since today’s market open.
- Previous shows the advances and declines for the previous trading day.
Sector Performance
The Sector Performance is a very useful tool for Top Down Analysis. It allows you to sector the best sector in the market and then drill down to the see the best stocks in each sector.
Indices
 The Indices report lists all ASX indices, including their names, their movement since market open, their most recent value, and the number of securities in each index. You can also drill through to reveal the composition of the Index.
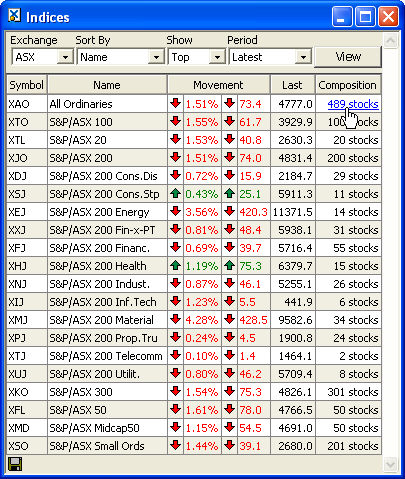
You can choose which exchange to view, how the list should be sorted, and the period for which values should be displayed. When you have finished adjusting the controls, click “View” to refresh the information.
Exchange allows you to choose to view advances and declines for Australian securities (“ASX”) or for US securities.
Sort By allows you to sort the list of indices by name, symbol, movement as a percentage, volume, or turnover. The volume of an index is defined as the total trade volume of all the securities that make up that index, and likewise for turnover.
Show allows you to select whether you want the items sorted in ascending or descending order. For example, if you sort by “% Movement” and choose “Top”, the list will begin with the index with the largest positive movement. If you choose “Bottom”, the list will begin with the index with the largest negative movement.
Period allows you to show movements for any of several periods:
- Latest shows the advances and declines since today’s market open.
- Previous shows the advances and declines for the previous trading day.
- Five Days shows the advances and declines over the previous 5 trading days.
- Last Week shows the advances and declines over the previous calendar week.
- Last Month shows the advances and declines over the previous calendar month.
- Dates lists the previous five trading days. Choosing the first date is equivalent to “Latest”. Choosing the second date is equivalent to “Previous”. Choosing any of the other three dates displays the advances and declines for that date.
World Summary
 The World Summary report gives a summary of international indices and exchange rates. Major instruments are presented in charts to give a quick visual indication of recent movement.
Exchange Rates
The Exchange Rates report gives a list of international currency exchange rates. Values are the mid rate of the buy and sell prices as at the close of the London Market.
For information about the various currencies included in this report, see the chapter World Markets.
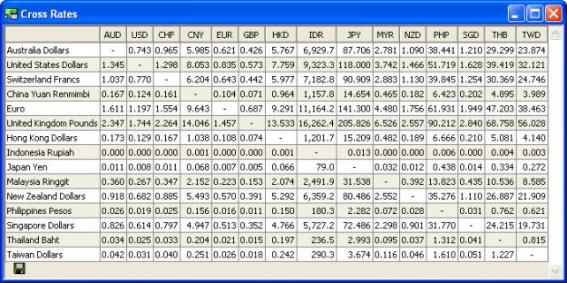
Cross Rates
The Cross Rates report is a table that shows the exchange rates between all of the available currencies, rather than just the exchange rates with the US dollar.