Overview
BullCharts is a powerful new real-time and end of day charting application. It is specially designed for active traders who need to monitor real-time data and conduct intraday technical analysis. BullCharts provides the power you need, and combines it with the reliability you expect.
BullCharts Workspace
BullCharts offers many great features suitable for the active trader and technical analyst. These features include:
- Wide range of technical indicators and line studies
- A customisable scripting language
- Flexibility to create your own indicators and signals
- The ability to monitor indicators and signals in real-time.
- Advanced usability, which makes BullCharts extremely easy to use
- Centralised and decentralised data options, which allows use of our adjusted data, or data from your own source.
The BullCharts Interface
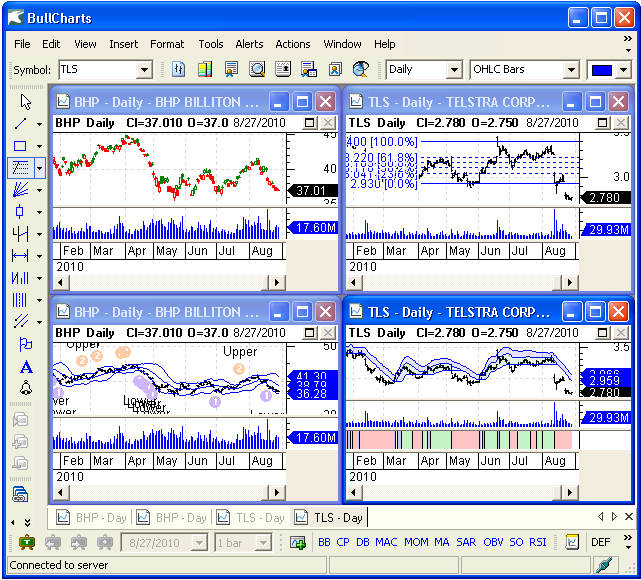
Here is a picture of the BullCharts main window, with the major parts of the interface highlighted:
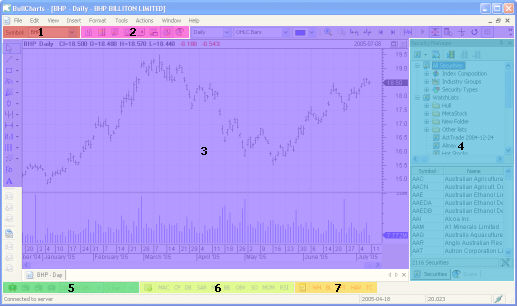
- The Symbol Toolbar allows you to change the symbol of the current chart, or any other window that’s specific to a particular security. For more details, see Pricing Information and Security Information.
- The Actions Toolbar allows you to quickly access a variety of information about the security in the Security Toolbar, including charts, Market Depth, Company Announcements and more. For more details, see Chart Toolbars.
- The current chart, the Line Studies Toolbar, and the various chart toolbars allow you to create and customise stock price charts. For more details, see Getting Started with BullCharts and Using Line Studies.
- The Securities Manager (press F6) (pictured here) and the BullScan Manager (press F8) both appear in this region of the screen. The Securities manager helps you manage groups of securities (“Watchlists”) and explore the stock market by index, industry group or security type. The BullScan Manager contains market-wide scans to help you find securities that match your personal trading strategy. For more details, see Securities Manager and BullScan Manager.
- The Training Mode Toolbar helps you judge the effectiveness of a trading strategy by simulating its historical performance. For more details, see Training Mode.
- The Indicator Toolbar gives you quick access to your favourite indicators. For more details, see Using Technical Indicators.
- The Template Toolbar gives you quick access to your favourite templates. For more details, see Using Templates.
What’s Different about BullCharts?
Largest offering of Indicators available in any Australian charting application. A wide range of technical indicators are provided, plus the potential for many more, with the custom indicator functions provided by the BullScript market analysis language.
The formulae for all indicators are provided by BullCharts, so no longer will you have to rely on “black-boxes” for your trading decisions.
Custom Indicators and signals allow you to take control of your trading strategies. Program your own indicators and signals using the BullScript Market Analysis language, which makes it easy to program your trading strategies for automation.
Data management is simple with our online database. Historical data is stored online, and can be downloaded and imported at the click of a button. Download daily data after trading ends and if you miss a day, BullCharts will automatically fill the gaps in your database.
Intraday data is also stored online, so it is downloaded automatically whenever you view an intraday chart. No longer will you have to wait for historical intraday data to accumulate by leaving charts open.
Advanced Usability makes BullCharts the most easy-to-use Australian charting application. As BullCharts was designed specifically for ASX data, the requirements of the Australian market were the prime consideration.
Description of Major Tools
Technical Indicators
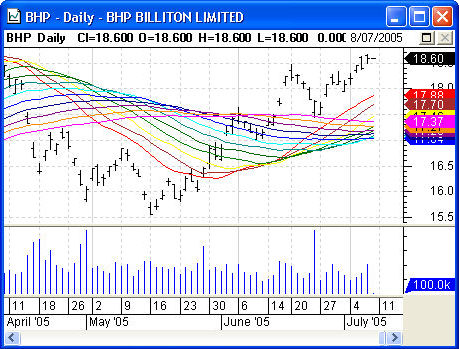
BullCharts includes the most comprehensive suite of technical indicators available in any Australian charting application. This range of indicators provides a strong tool kit for use in your trading. Each of these indicators can be used as the basis of your own signalling system, truly tailoring the BullCharts package to your trading style.
BullCharts provides a wide range of technical indicators
No More Black Boxes
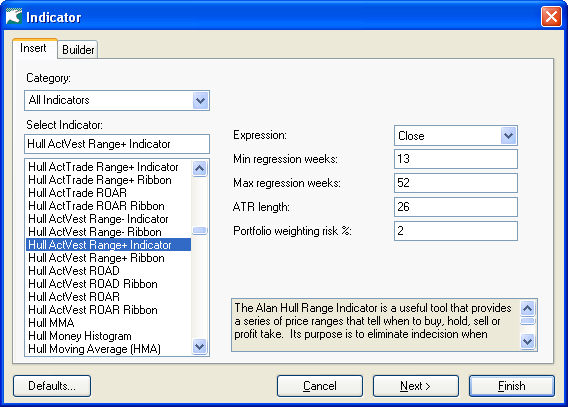
The formulae for all indicators in BullCharts are made available in the Insert Indicator wizard. BullCharts is a trading toolbox, which unlike expensive black-box programs, means that you have access to all information you are using to make important trading decisions.
The formulae for all indicators are available.
Having access to the formulae used for other indicators is important. It allows you to understand why a bullish or bearish indicator has triggered, and allows you to use concepts employed in other indicators to make your own, slightly different indicator or signal set, based on your own trading style.
BullCharts gives you complete flexibility in the way your indicators are displayed. Examples of how this is achieved are:
- The colour and style of the indicator plots can be customised.
- Parameters of indicators can be changed to suit your preferences.
- Indicators may be displayed on the same pane or a different pane to the security’s price.
Indicators may be displayed on the same or different pane to the security’s price.
Line Studies and Drawing tools
BullCharts provides a full range of line studies. Line studies may be placed on any chart to help you interpret movements in security prices or technical indicators.
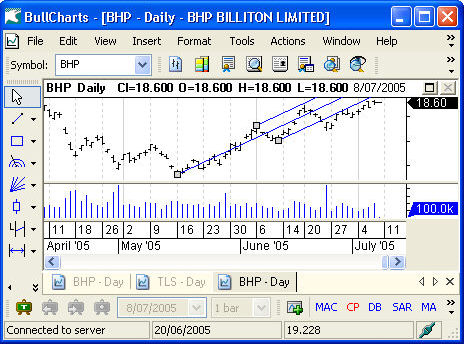
The Andrews’s Pitchfork line study suggests that an upward trend in BHP may have started to reverse.
BullCharts’ line studies are intelligent. As you zoom in or out of a chart or even change the time scale, the studies automatically adjust to the new settings. You can click and drag line studies to move, adjust or extend them to new requirements, so you will never have to redraw chart objects. Many studies also automatically snap to price values, so you can easily position lines accurately.
These features make BullCharts an extremely powerful application for technical analysis.
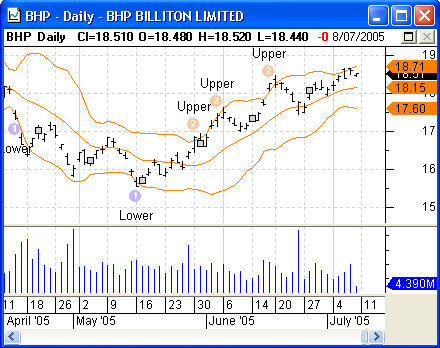
Indicators with Markers
Do you have a favourite indicator, and a special way you like to interpret it? Indicators with Markers can help you interpret certain events on your charts and automatically indicate them with markers, such as up or down arrows. BullCharts also helps by providing you with a number of popular pre-programmed markers.
BullCharts is shipped with the following Indicator markers sets pre-loaded:
- Bollinger Bands
- Candlestick Pattern
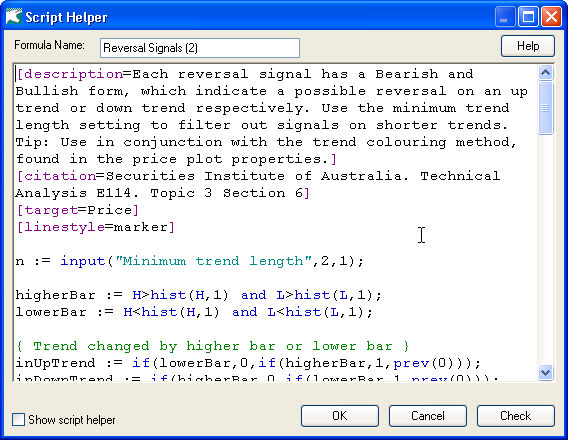
- Reversal Signals
- Moving Average Convergence/Divergence (MACD)
- Relative Strength Index (RSI)
- Stochastic
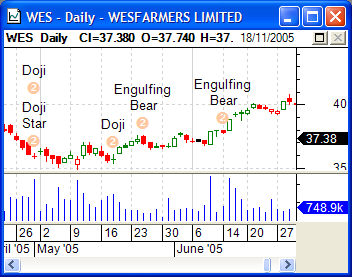
Candlestick pattern recognition is an exciting feature. BullCharts scans your data and recognises known patterns automatically. This saves a considerable amount of time over manually examining and marking charts for these sometimes illusive patterns.
BullScript Scripting Language
BullCharts comes enabled for BullScript- a powerful, yet easy to use language for programming your own indicators and pattern analysis.
Programming using BullScript is straightforward.
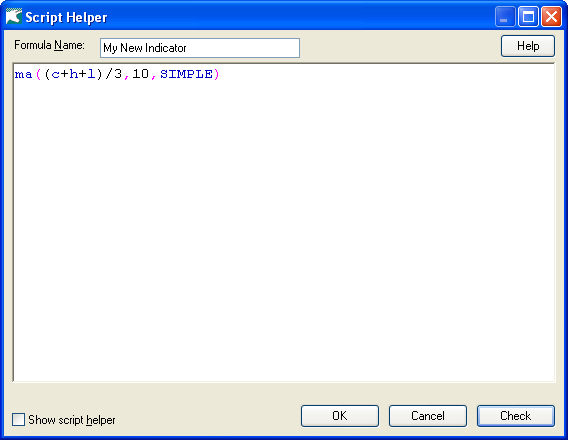
This formula gives the simple moving average of the security’s typical price.
Database Management
BullCharts gives you choices. You can elect to use our centralised database or import data from your current data vendor.
Centralised Database
Our centralised online database is designed to collect and store all your historical data. This way we can provide historical data on demand so you can focus more on analysis and less on data issues. However, you have the best of both worlds with our Online and Offline modes.
Online makes your data portable. Whenever you view a chart you can see the latest data without running long importing procedures.
Offline We also provide an option to download data from our centralised database to a local database so you perform your analysis offline.
Intraday and Real-time charts
Imagine having the power to monitor your indicators and signals live, rather than having to wait for hourly or end of day updates.
Intraday and real-time data is seamlessly streamed into the BullCharts software- you simply select the interval you need. As new data becomes available your charts update automatically, along with any indicators or signals calculated on the live or intraday data.
Advanced Usability
As the BullCharts interface is based on the workflow of the active technical analyst, you will find it very easy to use. Updating data is a simple one-click operation; you don’t need to worry about converting or managing data, as it is all done for you.
Loading a chart is quick and easy. Just type any security symbol into the symbol box at the top left of the screen then press Enter.The daily chart will be loaded, and you can change the time interval or chart type easily by selecting the desired interval or chart type from the Interval or Chart Type menus.
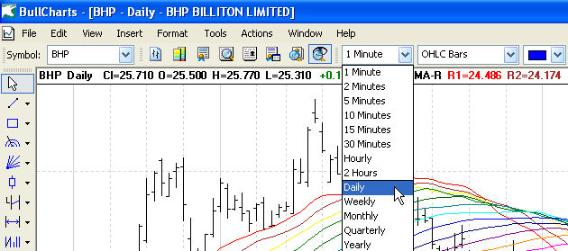
You can easily select the symbol, interval and chart type from the provided menus.