Alert Basics
The BullCharts Alerts feature can be used in a couple of ways to flag when the share price of a stock (or any index or security), or the volume, reach a “specific level” which you set in advance. The “specific level” might normally be a horizontal line across the price chart (at a support or resistance level, or any other price level), but BullCharts can also have a sloping alert line (as in a trend line).
How it works
You set one or more alerts for specific securities. When your End of Day data is downloaded in the evening, the Alert Scan will automatically run, and produce a list of any securities for which your Alert criteria was triggered. You can then review the triggered alerts.
Uses for BullCharts Alerts
The various uses for the BullCharts Alerts feature include:
- Stop Loss alert – Place a horizontal alert line on the price chart somewhere below the current price action, and set it to “Alert” when the Close is “less than or equal to” the Alert level.
- Target price alert – Place a horizontal alert line on the price chart somewhere above the current price action, and set it to “Alert” when the Close is “greater than or equal to” the Alert level.
- Trend line break – If you like to look out for a trend line break, you can set an “Alert Trend Line” by selecting the alternative option from the toolbar button (see below), and clicking twice on the price chart (or volume pane) to place the “Alert Trend Line” across the chart.
- Alerts on Volume – The above alerts can be set on the price pane of a share price chart, or on the volume pane of the price chart. By placing a horizontal alert on the volume pane you can be alerted of a volume spike above your alert line.
- Congestion zone breakout – Stocks can trade in a congestion or consolidation zone for long periods of time, and it can be useful to know as soon as the stock breaks out of that zone. Put one horizontal Alert line above a congestion / consolidation zone (and another one below) to alert on a price breakout above (or below) the congestion zone. Note that the triggered alert will only be identified and flagged when the Alert Scan is executed.
- To alert on leaving a trading halt – It can be useful to know when a stock comes out of a trading halt. Add two Alert lines as in the previous item.
Accessing Alerts
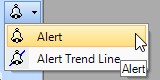 There are two ways to access the Alert functions – either using the menu (see below for menu and details), or if you have a price chart displayed simply click on the Alert toolbar button (see image at right). Note there are two different Alerts available from this toolbar button – the simple (horizontal) Alert and the “Alert Trend Line” option.
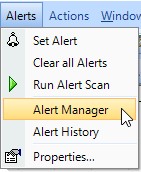 Note the following menu options from the drop down menu (see menu snap shot at right).
- Set Alert: Create a new Alert on the price chart.
- Clear all Alerts – To clear all Alerts.
- Run Alert Scan: Run all “active” alerts.
- Alert Manager: Open the Alert Manager window. This can take a few moments if you have many Alerts set.
- Alert History: Show list of triggered alerts.
- Properties…: Open the “global” Alert Manager Properties (see section below for details).
Alert Manager
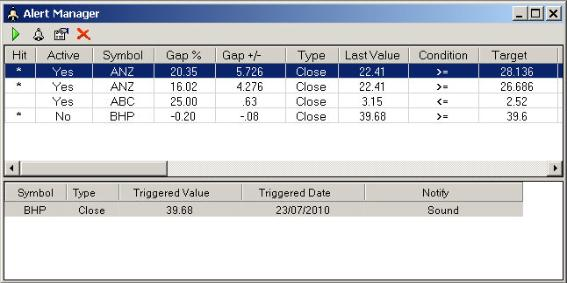
 : Run all active alerts
 : Create a new alert
 : Open Alert Properties window for a selected Alert
 : Delete a selected alert
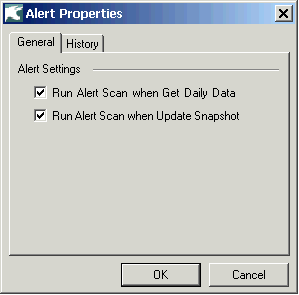
Alert Manager Properties
Alert Manager Properties allow user to set up when Alert automatically run and how many history alerts are kept. To open the Alert Manager Properties, go to “Alert” menu and choose “Properties…”
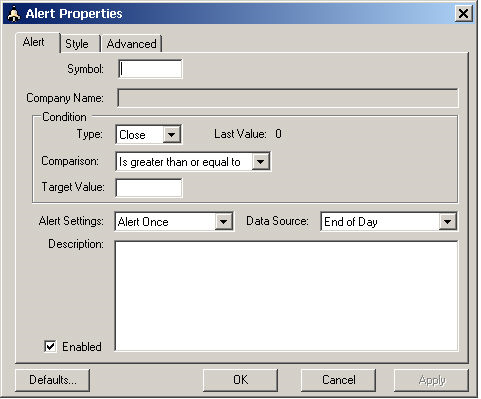
Create a new Alert
Go to “Alert” menu and select “Set Alert” to open “Alert Properties” window.
Edit an Alert
- Open “Alert Manager”.
- Select the alert you would like to make changes.
- Click
 to open the alert properties window.