Overview
BullCharts has two main scanning modules, BullScan and Market Scan.
Market Scan is a useful scanning tool that includes many fundamental and pricing choices to scan on. If you are on a live data plan, Market Scan will also scan on live data giving you a unique view of the market at that point in time.
BullScan, the other scanning module in BullCharts, has a primary focus on technical scanning with 215+ indicators using live or end of day data. There is a separate Getting Started with BullScan guide from the Help menu.
This section of the BullCharts manual describes the Market Scan feature. The BullScan feature is documented in another section.
Market Scan Basics
Starting Market Scan
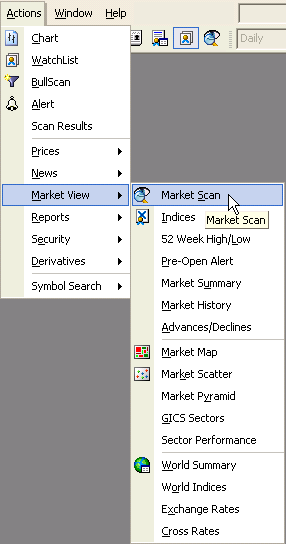
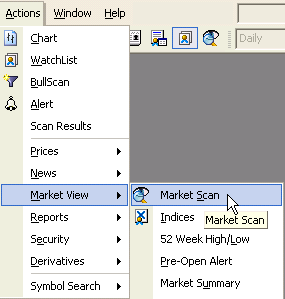
To start using Market Scan, you need to be online to the Internet. Once you are online, from the Actions menu, select Market View then Market Scan.
First Scan
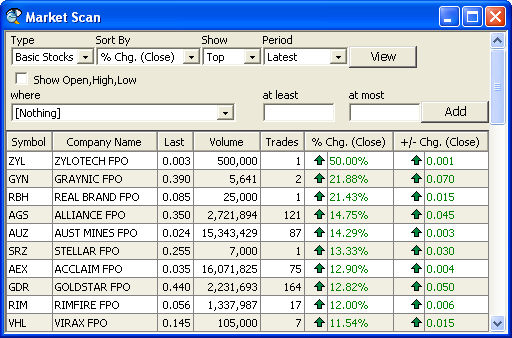
Each time you open Market Scan, the default scan will appear:
Scan Criteria
Security Types
You can choose what kinds of securities the Market Scan will examine.

Basic Stocks are more properly known as FPOs. They represent normal shares in a company.
Equities include Basic Stocks as well as other kinds of stocks.
Options scans through all options.
Warrants scans through all warrants.
Everything scans through all the above.
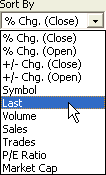
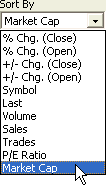
Sort By
The list of stocks can be sorted on a number of different attributes.
% Chg. (Close) sorts the list by movement since the previous market close, as a percentage.
% Chg. (Open) sorts by movement since today’s market open, as a percentage.
+/- Chg. (Close) sorts by movement since the previous market close, in dollars.
+/- Chg (Open) sorts by movement since today’s market open, in dollars.
Symbol sorts the list alphabetically by security symbol.
Last sorts by the most recent price.
Volume sorts by cumulative volume since today’s market open.
Sales sorts by cumulative sales since today’s market open.
Trades sorts by cumulative trades since today’s market open.
P/E Ratio sorts by each security’s Price/Earning Ratio – that is, the most recent price divided by the earnings rate per share.
Market Cap sorts by each security’s Market Capitalisation – that is, the most recent price multiplied by the number of issued shares.
Sort direction
You can view the results starting from the top or the bottom

Top shows the largest items in the list (the largest numbers, the most positive change, or symbols starting with A) first.
Bottom shows the smallest items in the list (the smallest numbers, the most negative change, or symbols starting with Z) first.
Scan Period
The Period list allows you to run your scan over different periods, so you can compare the results of a current scan, with what the same scan would have returned on a previous day, or so you can examine price movement over several days instead of just once.
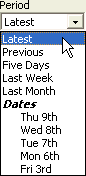
Latest runs the scan over the latest price information available
Previous runs the scan over price information as at market close on the previous trading day.
Five Days runs the scan over the previous five trading days.
Last Week runs the scan over the previous calendar week.
Last Month runs the scan over the previous calendar month
Dates contains a list of the last five calendar days, including today. The first item in the list is exactly equivalent to choosing “Latest”, the second is equivalent to “Previous”, and the remaining three show the price information as at market close on those respective days.
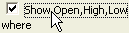
Show Open, High, Low
Although Market Scan will display Open, High, and Low columns if they are involved in the scan, you can force them to always appear by ticking the “Show Open, High, Low” box:
Creating a scan
A Market Scan is a list of fields. Each field listed will be a column in the result table, along with any default or standard fields. Each field may optionally include a range filter so that only securities for which that field is within the given range will be included in the results. If more than one field includes a range filter, only securities that match all the filters will be shown.
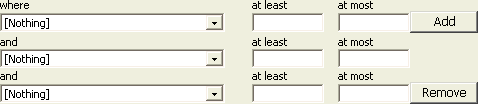
To add a new field: If there are no fields currently set to “Nothing”, click the “Add” button at the end of the first field to add a new field to the end of the list. When you have a “Nothing” field (an old field reused or a newly added field) you can set the field by choosing the new field from the list. Finally, click the “View” button.
To remove a field: If the field in question is at the end of the list, you can click the “Remove” button next to it. Otherwise, click on the Field List and choose “Nothing”, then click the “View” button.
To add a filter to a particular field: To show only securities where a field is greater than or equal to a particular number, enter the number in the “at least” box. To show only securities where a field is less than or equal to a particular number, enter the number in the “at most” box. Finally, click the “View” button.
You can enter a number in both fields. If the number in “at most” is less than the number in “at least”, you will get no results. Filters applied to a “Nothing” field have no effect.

To remove a filter from a particular field: Delete the numbers from the “at least” and “at most” boxes, then click the “View” button.
Example
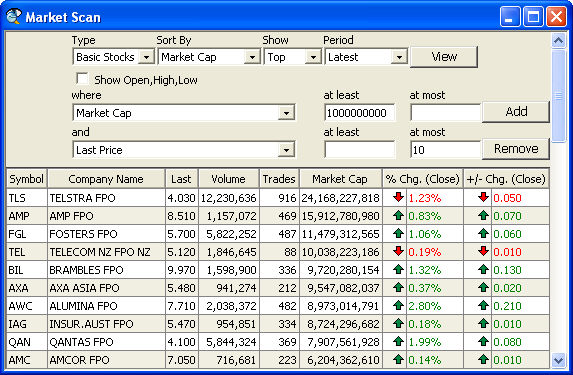
Let’s create a scan that shows Basic Stocks that currently have a Market Capitalisation over $1,000,000,000, a last price of less than $10, sorted by Market Capitalisation.
Step 1: Open a new Market Scan window by going to the Actions menu, then Market View, then choosing Market Scan.
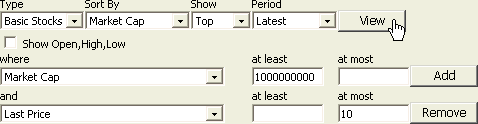
Step 2: In the new scan window, choose Market Cap from the Sort By list.
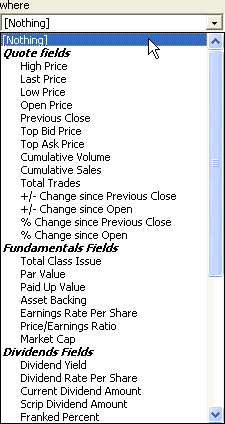
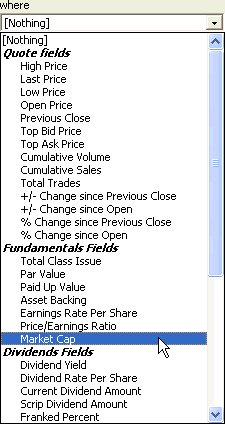
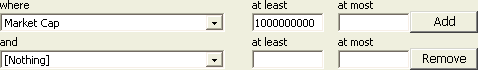
Step 3: In the first row, click on the “where” list, then scroll down to Market Cap, under Fundamentals Fields:
Step 4: In the first row, enter “1000000000” (a 1 with 9 zeros, without the quotes) in the “at least” box:

Step 5: Click “Add” to add a new row.
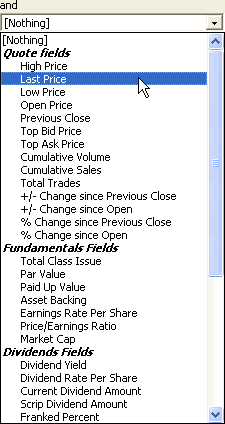
Step 6: In the new row, select Last Price from the field list.
Step 7: In the new row, enter “10” (without the quotes) into the “at most” box:

Step 8: Click the “View” button to perform the scan:
Step 9: View the results:
Searchable Fields
Market Scan can filter on all of the following fields.
Quote Fields
- High Price
- Last Price
- Low Price
- Open Price
- Previous Close
- Top Bid Price
- Top Ask Price
- Cumulative Volume
- Cumulative Sales
- Total Trades
- +/- Change since Previous Close
- +/- Change since Open
- % Change since Previous Close
- % Change since Open
Fundamentals Fields
- Total Class Issue
- Par Value
- Paid Up Value
- Asset Backing
- Earnings Rate Per Share
- Price/Earnings Ratio
- Market Cap
Dividends Fields
- Dividend Yield
- Dividend Rate Per Share
- Current Dividend Amount
- Scrip Dividend Amount
- Franked Percent
- Gross Dividend Amount
- Total Annual Dividend Rate Per Share
- Dividend Cover
Derivative Fields
- Margin Price
- Theoretical Bid
- Theoretical Ask
- Implied Volatility
- Premium Discount
- Shares Per Contract
- Exercise Price
- Warrants Per Share
Miscellaneous Fields
- Face Value
- Registration Unit Value
- Interest Rate
- Current Interest Rate
- Current Interest Amount
Troubleshooting
Can I save the settings for my preferred scans?
The current version does not support saving of the scan criteria.
Can I change the default scan?
This version does not support changing the defaults.