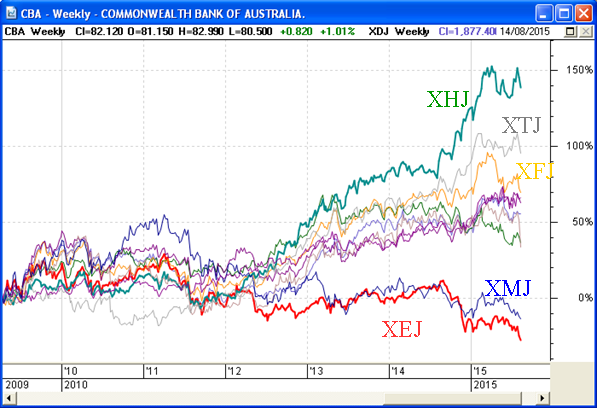
One of the features in BullCharts is the Comparative Percent Performance chart, as shown in the sample below. This particular example is the ten sector indexes of the Australian market, and their individual percentage performance since mid-2009. We can tell at a glance how each of them have been performing by reading the vertical axis scale (percentage). If we want to change the “start date” for the comparison, vertical axis scale (percentage). If we want to change the “start date” for the comparison, simply drag the chart (using the mouse) left or right.
One key feature of good charting software is the ability to display a single chart that directly compares the performance of one stock to another, or a stock to an index, or
to it’s own sector index. Such a chart could help to answer questions like:
- How has CBA bank been performing compared to it’s three big-bank peers
in the last 3 months? OR even in the last 6 years? - How has the CBA bank been performing compared to it’s own sector index
(the S&P/ASX 200 Financials XFJ)?
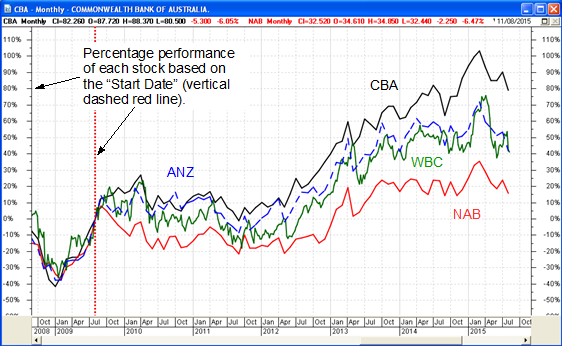
The sample price chart below shows the percentage performance of the big four banks since the (arbitrary) “Start Date” of August 2009 (a monthly chart).
This Comparative Percent Performance price chart feature can display a price chart
of either:
- A stock and it’s sector index; or
- Two (or more) stocks;
with the price of the plotted securities* displayed in terms of percentage change, and adjusted to the same level as at a base date that you specify. The vertical (price) axis indicates percentage change of each individual security (not a dollar price).
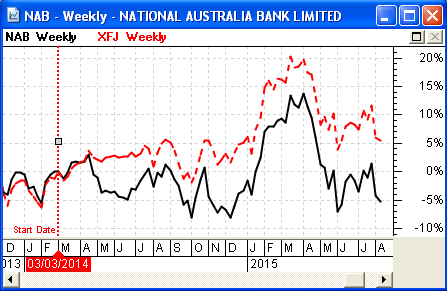
The sample weekly price chart at right shows the NAB bank and it’s XFJ sector index since 3rd March 2014. It clearly shows that NAB is down about 5% since that start date, while the XFJ sector index is up about 5%. This chart can help to quickly visually look for things like potential price mean reversion candidates.
How to display the Comparative Percent Performance price chart:
- Display a price chart for the stock that you wish to analyse.
Click on the “Comparative Percent Performance” toolbar button.
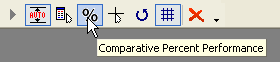
2. Click on the new “Comparative Percent Performance” toolbar button
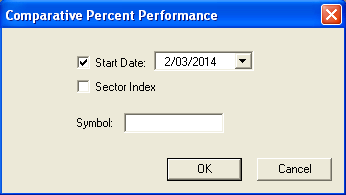
In the dialogue box that will appear you have the following options:
- Start Date — Specify a date from which the price change over time is based. The default Start Date of the comparison (uncheck the tick box) is from the left hand edge of the screen.
- Sector Index — Check this box so that BullCharts will automatically display the relevant Sector Index* for that stock. If you are viewing a price chart for a stock that is in a watchlist, and you then select the next stock in the watchlist, the relevant sector index will be displayed.
- Symbol field — To compare the displayed stock to one other stock, simply enter the stock code in the Symbol field. To compare it to more than one other stock, enter the other stock codes separated by a comma (and with no spaces between the stock codes — only a comma).
Also note:
- If you view the chart with the vertical dashed red line indicating the start date for the comparison, you can “grab” the vertical line (using the mouse cursor) and drag the line left or right to easily change the comparison start date.
- You can easily change many of the parameters for each price plot on the chart (either double-click on the particular price plot, or right-click and select “Properties” from the drop-down options list), including:
- The colour of each price plot line on the chart (ie. to have a different colour for each stock or index that is displayed).
- The plot type (candle, line, etc.).
- The line style for each price plot (dashed, dotted, line, etc.).
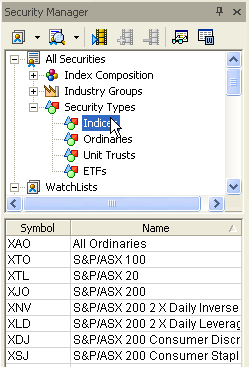
* Sector indexes — To see a list of sector indices and their codes in BullCharts, view the Security Manager, and expand the “All Securities” category, then the “Security Types”, and click on the entry “Indices” to view all the indexes in the lower window pane.