Understanding Candlesticks
Candlesticks area powerful way to analyze the trend of a stock graphically. An excellent book on candlesticks is The Secret of Candlestick Charting by Louise Bedford.
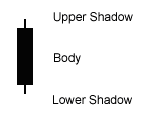
Parts of the candlestick
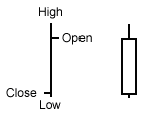
The White Candle
A White Candle is where the close is higher than the open.
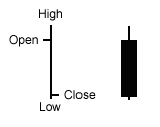
The Black Candle
A Black Candle is where the close is lower than the open.
Colour system for Candlesticks
The colours for Candlesticks can be modify to provide more information on the trend of the stock. More details on the different colour systems can be found at Stock Movement Bar Colour System
The Elements of the Candle
Daniel Gramza, a US-based trader, is a worldwide authority on the use of candlesticks. Daniel has been a key mentor for many traders in the arena. He professes that there are several key elements to the formation of a candlestick. These are listed as follows.
1. Candle Colour
The colour of the candle is a major consideration in many candlestick patterns. White has bullish implications, and black indicates bearish selling pressure.
2. Candle Range
The range from the high to the low, or the peak of the upper shadow to the base of the lower shadow, is a general indicator of the level of volatility for that period.
3. Candle Body Size
The size of the real body can provide a clue as to the level of conviction of either the bulls or the bears. The presence of a long candle in relation to the most recent candles of previous days holds special significance. It is very likely that a dominant candle will provide an indication as to immediate future trading activity.
A small bodied candle shows indecision by the bulls and the bears. Neither buyers nor sellers would appear to be unduly influencing the session characterised by a small real body.
When discussing candlestick patterns, the real body assumes a far greater significance than the candle range or the candle shadows. Most of the two and three-line candle patterns (i.e. where more than one candlestick actually forms the pattern in its entirety) rely on a ‘body-to-body’ comparison. Although the candle range is important, it is actually the real body relationship to another candle’s real body that is critical in defining patterns.
4. Shadow Location
The shadow provides an indication of buyer or seller strength. If there are long upper shadows at the top of an uptrend, this implies that the buyers have weakened and the sellers have begun to move in. If there are long lower shadows at the bottom of a downtrend, the price has dropped to a low enough level to encourage buyers to purchase the share. These rejection patterns are very easy to recognise.
5. Shadow Size
The length of the shadow complements the indication of buyer or seller strength provided by the shadow location. The longer the shadow, the greater the market rejection of the price levels being tested by that share. For example, long upper shadows suggest that the market cannot continue in the predominant uptrending direction for long. This is especially relevant if the share has displayed shadows in the past at that same price level.
6. Candle Development
By breaking down the time increment of a candle’s development, an interesting story will often be revealed. For example, a black candle that represents one week may be made up of four bullish daily candles, and one decidedly bearish daily candle. Candle development dissects one candle to create many candles (of shorter time duration that the original).
Using the process of candle addition can assist in further ascertaining the ultimate meaning of a candlestick. This process adds the candles of several periods together to create just one candle. In effect, it takes the data from several periods and reduces it to one period.
7. Candle Location
It is necessary to examine several phases in order to understand the true meaning of a candlestick pattern. By disregarding one of these stages, the predictability regarding the outcome of a candlestick pattern will be limited.
There are three stages: the lead-up, the trigger, and the confirmation phase.
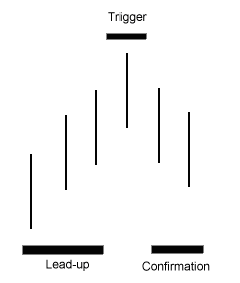
The lead-up to the appearance of a candle pattern must be considered in order to assess the potential strength of the reversal or continuation pattern. The lead-up consists of the activity of several of the preceding candles. For example, reversal patterns are only relevant if the share has already been trending, and will not be as appropriate for use while a share has been range trading.
The trigger candle pattern is the actual appearance of a reversal or continuation pattern. For a one-line candle, the trigger will be represented by one session only. For more complex two-line patterns, the trigger will include two sessions, etc.
Inexperienced traders who learn about the power of the candle are most likely to place all of their emphasis on the appearance of the trigger. If you look only at the trigger, and ignore the lead-up and confirmation phase, you will not receive the full benefit of utilising candles to their maximum potential. Every phase is of equal importance.
Confirmation regarding the effectiveness of the candlestick is also an essential component of using this method of analysis. Some candlestick patterns require greater levels of confirmation than others.
The micro-study of a candlestick pattern must also be viewed in the context of the overall market environment. For example, if a share is in a mature stage in comparison to a newly-introduced share, this will have a marked effect on the interpretation of a candlestick. Previous levels of support and resistance must also be considered.
The Secret of Candlestick Charting, Louise Bedford p15-16