Overview
BullCharts provides you access to the Trade Planner tool for Risk Management, and Return Analysis of a stock. The Trade Planner offers a number of different inputs (as described below), and calculates various trade parameters. With these tools you are able to find when you should buy or sell a particular stock.
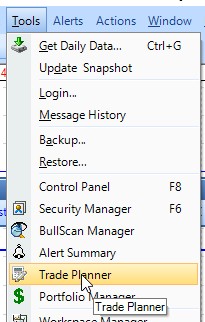
 To access the Trade Planner, go to the Tools menu, choosing Trade Planner (screenshot below), or the toolbar button on the BullCharts Actions toolbar (shown at right).
Trade Planner In Depth
Descriptions for each of the fields in the Trade Planner are listed below (using the blu9e numbers to cross reference the items with the explanatory text).

| Field annotation | Description | |
|---|---|---|
| 1 | Entry | Your intended purchase price. |
| 2 | Target | Your desired target price, or profit amount, or % Return (and check the relevant radio button below it). |
| 3 | Price| Profit |% Return | Indicate if the Target amount entered is the Price, or the desired Profit amount, or the desired Percentage Return. |
| 4 | Stop Loss | Your intended Stop Loss value, or use the Calculator to assist. |
| 5 | Quantity | Your intended Quantity (or Number of Contracts for Options), or use the Calculator to assist. |
| 6 | Shares/Contract | The number of Shares per Contract. |
| 7 | Brokerage
(or Commission for CFDs) |
The amount of brokerage (or Commission) applicable for the Entry and for the Exit (ie. the one-way amount). |
| 8 | Time in Market | Your estimated number of days in the market (used for the Annual Return % amount). |
| 9 | Margin % | For CFDs — The Margin percent amount that is required by the CFD provider (% amount). |
| 10 | Annual Interest Rate | For CFDs — The annual interest rate charged for overnight positions (% amount). |
| 11 | Target Price | The Target Price — is either your Target Price or is calculated based on your Target Profit or Target % Return. |
| 12 | Risk/Reward Ratio | This is the ratio of risk to reward (or the inverse of the reward to risk). A value less than one is better. A value greater than one means the risk is greater than the reward. |
| 13 | Initial % Risk | The initial risk (%) derived as (Entry-StopLoss) Entry. |
| 14 | Initial $ Risk | The initial risk amount ($) derived as (Entry-StopLoss) * Qty. |
| 15 | Total Entry Cost | The cost of the trade entry, including the Brokerage amount. |
| 16 | Breakeven | The share price that is required in order to break even on this trade. |
| 17 | Profit | The anticipated profit assuming a trade exit at the Target price. and factoring in two times the Brokerage. |
| 18 | Return % | Profit/Entry cost (including all brokerage) |
| 19 | Annual Return % | The Percentage Return annualised. |
| 20 | Margin Required | For CFDs — The amount of margin that is required by the CFD provider. |
| 21 | Daily Interest/Share | The dollar amount of interest that is charged per share per day for overnight positions. |
| 22 | Margin Cost | The Margin Cost for the expected “Time in Market” |

