Overview
BullScan is one of the most powerful yet easy to use scanning tools for the stock market. You are able to build up a set of scan criteria to select stocks that match your trading strategy in a simple three-step process.
What’s Different about BullScan
- Full control to vary any parameters of an indicator, giving you greater choice in your scan strategies.
- Ability to easily cross any indicator with any other indicator
- Option to include partial periods in a scan such as a mid week scan on weekly data.
- Scan on a live snapshot of the market
- Unique customised macro feature that allows you add in formulas to refine the scan search using BullScript.
- Simple English like description of your search criteria so you can confirm the basis of your scan criteria.
The BullScan Screen
The following is the main screen for BullScan listing a range of scans.
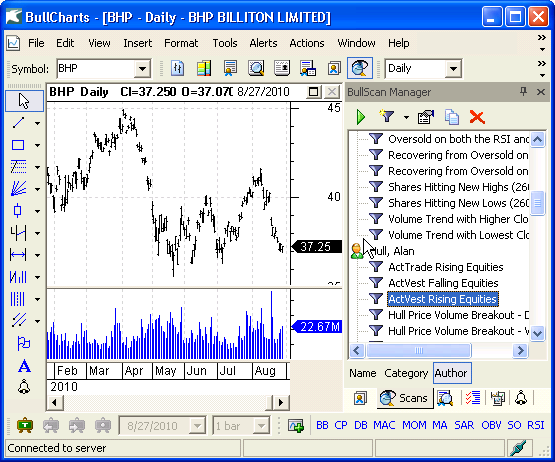
Using BullScan Manager
The BullScan Manager lists all the scans that you have created.
You do not need to manually save and load scans to disk. BullScan does this automatically.
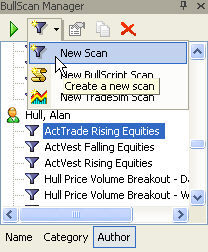
Run starts to search the database based on the criteria of the currently selected scan.
New creates a new set of scanning criteria
Edit modifies the existing scan criteria and general details about the scan including description and author.
Delete removes the selected scan from the BullScan Manager.
BullScan Manager
The BullScan manager will automatically arrange your scans by either Category, Name or Author, making it easier to find the scan you’re looking for. Click on the tabs at the bottom of the BullScan Manager to change how the scans are grouped.
Folders for categories and authors are created, updated and deleted automatically when the properties for a scan are changed (found in the General tab of the scan properties).
Organising your scans
To create a new category, or a new author, simply edit the properties for a scan. When you change the author or category property for that scan, a folder will automatically appear and the scan will be placed in that folder.
You do not need to save and load your scans. Rather, they are automatically loaded into the program when it starts. However, if you do need to access the files for your scans, they are stored in the Scans directory, under the BullCharts program folder. It is strongly recommended that you do not rename your scan files on disk directly. Rather, rather rename them by changing their Name property in BullCharts.
Important: if you edit any of the built in scans, then upgrade BullCharts to a newer version that includes an updated version of that scan, your edited version will not reflect the changes made in the update. To take advantage of the updated version of a chart, you must click the “Load Original Settings” button (see the description of the Advanced tab below), then manually reapply all the changes you made.
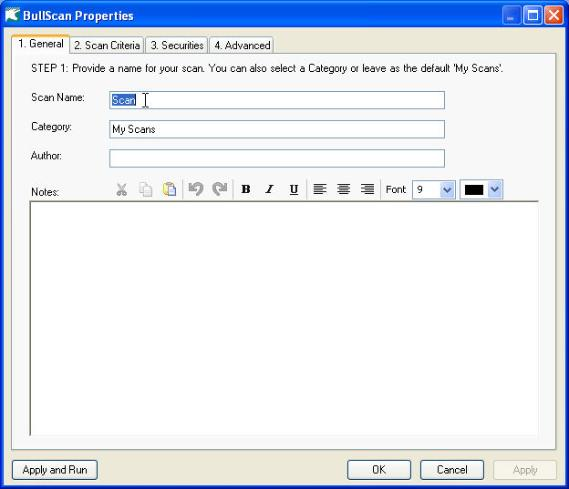
General
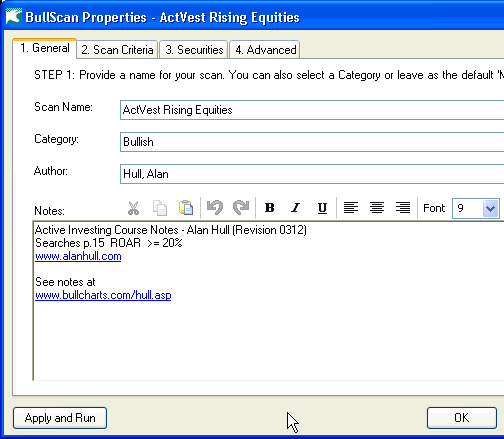
When you create or edit a scan, you will be shown this scan properties window. After creating a new scan, you will be on the general tab by default. If you edit the scan later, you will be taken to the Scan Criteria tab by default.
The detailed shown on this General tab, such as Name, Category and Author, will be used to organize scans in the BullScan Manager. Each scan must have a unique name, so you may be prompted to rename your scan if a name is already in use.
You can also enter a notes for your scan. This is a good place to write notes for yourself such as why various criteria are used, how to interpret the results, and so on. You can use the formatting buttons to apply effects such as bold, italics, and colour to your text. Click on the word Font to adjust the font. Standard editing functions: cut, copy, paste, undo and redo are also available from the toolbar. It is also possible to copy and paste small images from other programs into the notes area.
Any web addresses that appear in the notes section will appear in underlined blue. If you click on the address, your default web browser will start and go to that web site.
Apply and Run saves changes, closes the window, and starts the scan
OK saves changes and closes the window
Cancel closes the window and disregards any changes
Apply saves and changes, but leaves the window open
Scan Criteria

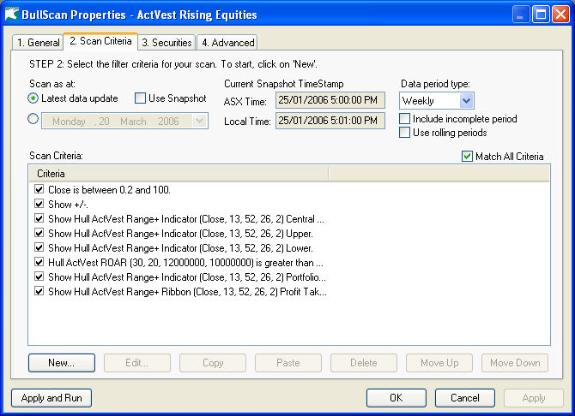
Criteria A scan is made up of one or more criteria that will be used to find securities. For example the window shows may be interpreted as: “Find me all securities that have increased by 10% in price and doubled in volume over the last day”.
Use the buttons to create, modify, copy and delete scans. You can select and copy multiple criteria between scans.
Copy/Paste The copy and paste button will copy/paste the scan criteria to the clipboard (as opposed to immediately creating a copy). You can copy one (or several) criteria from one scan, and paste it into another scan. Alternatively, you can paste criteria into a word document, and a description will be pasted.
Item Enabled The tick box to the left of each criteria lets you temporarily enabled/disable a particular criteria. If the criterion is not checked then it will be disregarded.
Match All Criteria By default, when the scan runs, a security will be shown if it matches all of the criteria. If you un-tick Match All Criteria then each security is given a score based on the number of criteria matched, and the relative importance of the matched criteria. This system allows you to create a scan with many criteria, but not miss an opportunity if a security fails on a less important criterion. However if there are some criteria that you want to explicitly match then set the required property to true (either by right clicking on the scan and selecting Required, or in the criterion property page).
Scan Date and Period
The scan period settings appear on the Scan Criteria tab of the Scan Properties window.
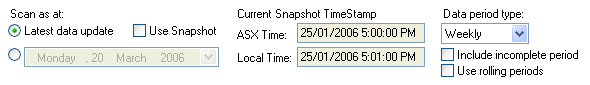
Scan As At You can change the date that is being scanned from this tab. The scan is performed using only data before and on that date. Typically you will want to scan from the latest data update. Note, if the scan period is set to anything other than daily, then scan date must be set to the last day in the period. For example, when explicitly selecting a date for a weekly scan, select the Friday, not the Monday.
Use Snapshot The Snapshot button allows you to download a snapshot of the market for scanning depending on what data plan you have subscribed to. Both the local database for scanning is updated as well as the chart.
Intraday 20 minute delayed data allows you to download a 20 minute delayed snapshot at 11.20am, 12.20am, 1.20pm, 2.20pm, 3.20pm and 5pm. The data is 20 minutes delayed, so for example the 11.20am snapshot is data current as at 11.00am. The charts will also show an intraday last data point to match the snapshot data. You will know the currency of the data from the ‘Current Snapshot Time Stamp’.
End of Day allows you to download one intraday snapshot at 5pm.
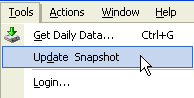
Live allows you to download data live to then do a scan. You are able to update the snapshot with live data every 10 minutes. When you run the scan, BullCharts checks to see how long it has been since you last downloaded a live snapshot. If the last snapshot is more than ten minutes old (configurable in the BullCharts preferences), you will be asked if you want to download a fresh snapshot. You can also manually download a live snapshot by selecting “Update Snapshot” from the tools menu. Note that there is a restriction on how frequently you can download snapshots.
When the Snapshot option is ticked, the current snapshot value for each security is appended to the data series for each security. So a current snapshot on a daily chart will load one bar for each day, plus an additional bar for the current data. This data gets fed into the BullScan for analysis.
Data Period Use the period to scan on daily, weekly, monthly, quarterly or yearly data. If incomplete period is ticked, then an incomplete week (e.g. if scanning on a Wednesday) will be included in the scan. If it is not ticked, then the last completed week is used. Note: If you are scanning on Friday, then the last week will not be used until you have downloaded the latest data for the Friday.
Include incomplete period is a unusual option to be able to scan on partial periods such as Weekly, Monthly, Quarterly and Annually. For example, if you are scanning on a weekly period, you are able to scan during the week rather than wait for the completed data update on a Friday. This option will also include live data if the live checkbox is ticked.
Use rolling periods Normally weekly and monthly scans are created by grouping daily data into indivual weeks and months. When “Use rolling periods” is selected, the groupings are shifted so that a complete group is finished on the last bar being scanned (typically the latest data available). Weekly bars are then calculated from these groupings, which are then used for your weekly scan. These options are also available for monthly, quarter and yearly scans and work in an equivalent manner.
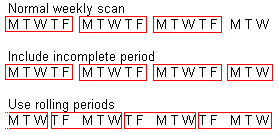
The above diagram illustrates how the various time period options affect a weekly scan. The red boxes indicate how daily data is grouped together to form weekly bars for scanning.
Securities
With BullScan, it is easy to apply your scan against a selected group of stocks. This can be your own watchlist, Industry groups or against an Index such as the S&P 200. 
You are also able to select your own default groups to search on.
In the Securities Manager you can right-click on a symbol group and then select it as the default group for future searches.
Advanced
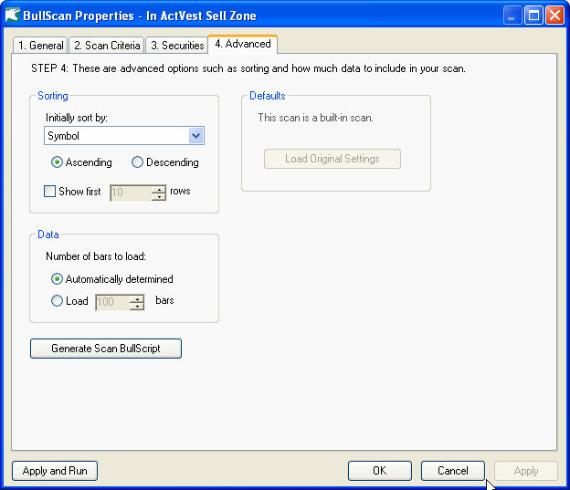
The Advanced tab holds miscellaneous scan settings.
- Sorting
Once you have run a scan, you can sort by any column by clicking on the column heading. However, the settings on the Advanced tab allow you to select the default sort column. A list of columns is automatically created from your criteria. You can sort on any of these columns.
It is also possible to restrict your results to a certain number of securities. Combined with sorting this allows you to create reports such as “Top 20 by Volume” and “Top 10 Biggest gainers by % movement”.
Once the results are calculated, all results are stored even if only the top few are displayed. This means that if you re-order by another column then the list of securities shown will be updated to reflect the top securities by the new column.
- Data
BullScan will usually be able to determine how many data points are needed for a given scan. However if it is unable to then it will select 100 data points. There are other reasons why you may want to manually override the number of data points loaded. This setting is for advanced users only.
- Defaults
If you have edited a built-in scan then a defaults panel will appear in the advanced tab. Clicking on the Load Original Settings button will undo any changes that you have made to the built in scan. If you had renamed the scan then it will also restore the scan to its original name.
If you made a copy of a built-in scan then the copy does not show this option. It is treated as a completely custom scan.
- Generate Scan BullScript
From version 2.5 it is possible to create a scan entirely using BullScript. To assist in creating BullScript based scans, the “Generate Scan BullScript” button will automatically convert a traditional criteria based scan to BullScript. Click the copy button to copy the BullScript, then create a new BullScript scan and paste the BullScript in.
BullScript Scans
In addition to creating a criteria based scan, it is possible to create a scan entirely using BullScript. This is recommended only for people who are familiar with BullScript. Click on the arrow next to the “New Scan” icon in the BullScan manager, then select “New BullScript Scan”.
This will create a new scan that is similar to the traditional criteria scan, except instead of a criteria tab, there is a BullScript tab. The BullScript scan may be used in one of two ways. You can either write the entire scan as a single script, or you can write BullScript for each individual column and the filter separately.
- Script Entire Scan
This option gives you the most control over how a scan works. You can control the attributes for each scan column, and you can also set up variables that can be reused more easily.
An entirely scripted scan has the following format: The first result of the script is interpreted as the filter. If it evaluates to true (or non-zero) then the security is included in the scan results. Otherwise the security is disregarded. If you do not want to filter securities then place true; at the start of the script. Any other following results are used to display columns. Use the name attribute to assign column names.
To generate sample scripts, use the “Generate Scan BullScript” button on a normal criteria scan, as described above.
- Script Each Column Separately
This option allows you to specify separate BullScript for each column and the filter. This can be useful for people converting scripts from other scanning applications. The filter script may also refer to the results of the column scripts by referring to variable names such as colA.
Creating Your First Scan
Step by step instructions:
- Click on the Actions menu and select BullScan
- The window above should appear. Type “My First Scan” into the Scan Name box.
- Type your name into the Author box (optional).
- You can also optionally add some notes, and category.
- Click on the Scan Criteria tab
- Press the New button to create a new criterion
Adding Different Scan Criteria
First Value
- We will work with the Close, so leave the First Value panel as it is.
Condition
- Change the first drop-down in Condition to Crosses Above.
- And change the number of days to any day in the last 3 days.
Second Value
- Select Is an Indicator from the first drop-down under Second Condition.
- Select Moving Average from the drop-down immediately below.
- Press the Parameters button. A new window will appear.
- Enter 30 into the Time Period box
Your window should now look like the one shown here. Press OK to close this criterion and return to the scan editor.
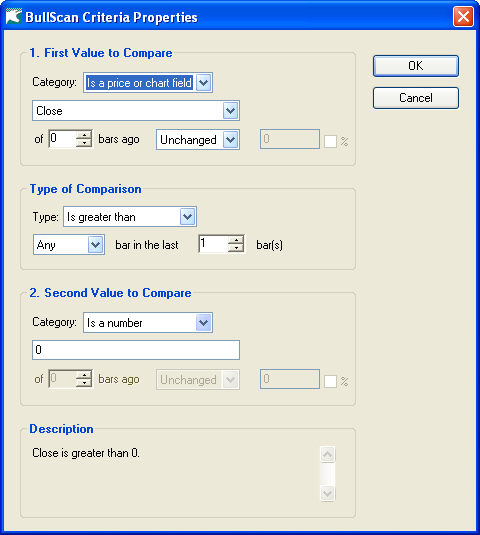
Understanding BullScan Criterion Values
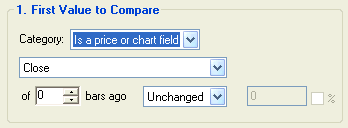
The comparison criteria usually consist of two values, or numbers, that get compared. Each value looks like the panel shown above. The first row gives the type of value being selected. The second row defines the value itself, and the third row makes modifications to the value.
Types of Values
- Is a price or chart field allows you to select from a number of different fields available to scan on such as High, Close, Volume, Trades and so on.
- Is a number is for you to enter your own specific number. For example, if you wanted to find securities with a volume greater than 1,000,000 then you would select the First Value as Close, Condition as Greater Than and the Second Value as 1000000.
- Is an indicator gives you access to all the indicators available in BullCharts including any that you have created yourself. If the indicator has settings, or returns multiple results then the Parameters button will be enabled. You can use this button, for example, to set the length of your moving average, or set if you want the top Bollinger band or bottom Bollinger band.
- Is an indicator signal allows you to test for signals and markers that are already provided by an indicators. Also select this option if you want to scan for candlestick patterns. Where an indicator has multiple signals, you must select which signal is being scanned.
- Is a fundamental allows you to select a range of fundamentals to search on. This allows you also to limit your search based on such criteria as market capitalization or P/E ratio.
- Uses BullScript gives you a convenient way to further customize the search criteria for advanced users. You can enter your own formula such as (High + Low)/3 to further refine the scan. Please refer to the Getting Started with BullScript guide available from the main Help menu. Only expressions are allowed. You may not define variables. (Internally the entire scan uses BullScript, and your script is copied into the scan’s script).
Available Price or Chart Fields
- Open is the open price for the stock.
- High is the high price for the stock.
- Low is the low price for the stock.
- Close is the closing price or last price for the stock.
- Volume is the volume for the stock.
- Value Traded is the cumulative sale value for the stock
- Trades is the total number of trades for the stock.
- Previous Close is a convenient way to reference the previous day’s close. This is the same as selecting Close and then set Of Days Ago to 1 to scan on yesterday’s close.
- Price Change is also a convenient way to select stocks based on their absolute movement. An additional option of Over Days Ago will appear. The days referred to here are trading days, not calendar days.
- Price % Change is the percentage movement. It also has the option to select over how many days to include in the scan.
- Highest High will select the Highest High that appeared in the nominated time period. This is a useful option to select the highest high that occurred over the last week, quarter or year. As the Over Days Ago uses the number of trading days, you would type5 to find the highest high for the last 5 trading days.
- Lowest Low is similar in function to the Highest High but scans for the lowest low over the nominated period.
- Median is the average of the high price and low price.
- Typical is the average of the high price, low price and close price.
Of [ ] Bars Ago
The Of Bars Ago feature specifies a horizontal offset for the data, similar to that used in some indicators. Use 0 for the latest date in the database, 1 for yesterday and so on. The term ‘bars’ is used as the period can be daily, weekly, month or yearly. The bars referred to are trading days.
- The following are some sample scans that use this feature.
- Close is greater than previous close.
- This will show movement of stocks that have gone up since yesterday.
- Close is greater than close of 5 days ago.
- This will list stocks that have increased in price in comparison to what the price was 5 days ago.
- Close is greater than the highest high over 5 days of 2 days ago
Of Bars Ago will provide an offset if you wish to start the scan period earlier the current date. In this example the highest high is calculated over a 5 day period but the period scan started 2 days ago. Therefore this is equivalent to the highest high between 2 days ago and 7 days ago (inclusive).
It’s important to remember that this delayed value is what will be shown in the results page. For example, if you compare today’s Close to yesterday’s moving average, then the value shown in the report for Moving Average will be yesterday’s value.
Tip: Use 1 day ago for values that are modified by the close price. For example, if you wanted to find securities that had broken their 50 day highest high then Close is greater than Highest High over 50 days would not work because the highest high would also have changed. So use Highest High over 50 days of 1 day ago to determine the value.
Modify by
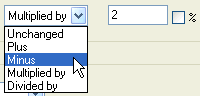
This option will modify the value selected. This is useful to determine when one value has exceeded another by a certain amount.
Example 1: Volume has double since yesterday could be calculated as Volume is greater than volume of 1 day ago times 2.
Example 2: Close has fallen by at least 10% could be calculated as Close is less than close of 1 day ago minus 10%.
- Unchanged will leave the value unmodified.
- Plus will subtract from the select value. If you wish to see which stocks have gone up by a certain percent then tick the % box.
- Close is greater than previous Close + 5%.
- This will show all stocks that have gone up by 5% since the previous close.
- Increasing something by n percent is equivalent to multiplying it by (1+n/100)
- Minus will reduce the selected value by a fixed amount or percentage.
- Decreasing something by n percent is equivalent to multiplying it by (1-n/100)
- Multiplied by will multiple the selected value. Multiplying something by 200% is equal to multiplying it by two.
- Divided by will divide the selected value.
- Percent Box If modify is set to plus, minus or multiply, then the percent checkbox becomes available. For plus or minus it means a relative percentage is added or subtracted to the calculated value. For multiply, it means the multiplying number gets divided by 100. Note: The following three modifications would achieve identical results “plus 100%”, “multiplied by 2”, and “multiplied by 200%”. Note: Do not use the % checkbox with the price field “Price % Change”. For example, if a price change of 10% was calculated, and you said to add 30% to that value then the result will be 13%, not 40%. This is because all calculations are done on the underlying numeric value – in this case 10.
Understanding BullScan Criterion Conditions
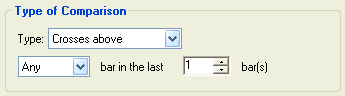
- Crosses above is much the same as specifying is Greater Than. However, the value needs to have moved from less than to greater than – rather than remaining greater than the whole way through – and it must have done so within the last so many days you specify. For example, series $2,$3 is greater than series $1,$2, however it has not crossed above. Series $2,$5 has crossed above and is greater than series $3,$4.
- Cross below is similar to Crosses above, but works upside down. The first value must have been previously greater than the second one, then moved to being less than the second one.
- Crosses is true when either crosses above is true or crosses below is true.
- Is greater than the first value is numerically greater than the second value.
- Is greater or equal to the first value is numerically greater than the second value, or both values are numerically equal.
- Is less than the first value is numerically less than the second value.
- Is less than or equal to the first value is numerically less than the second value, or both values are numerically equal.
- Is equal to both values are numerically equal.
- Is not equal to the two values are different.
- Has increased only uses a single value. It requires that the specified value, e.g. Closing price, has increased over a given number of days.
- Has decreased only uses a single value. It requires that the specified value, e.g. Closing price, has decreased over a given number of days.
- Is the highest it’s been the value is greatest it’s been over a specified number of days.
- Is the lowest it’s been the value is smallest it’s been over a number of days.
- Different by at least Value one minus value two is greater than (or equal to) the specified number, or value two minus value one is greater than (or equal to) the specified number. Useful for detecting spreads between bands.
- Different by at most Value one minus value two is less than (or equal to) the specified number, or value two minus value one is less than (or equal to) than the specified number.
- Is between Accepts three values. Requires that the first value is between the second and the third, inclusive. For example: the price is between the two Bollinger bands.
- Is not between Accepts three values. Requires that the first value is not between the second and the third, inclusive.
- Is true For use with “indicator signals” and “BullScript” value types. For example “Doji Star is true” will find securities with a Doji star on latest day.
- Is not true The opposite of Is True: this will match securities where the specified signal has not occurred.
- Is not between Accepts three values. Requires that the first value is not between the second and the third, inclusive.
- Show this value Allows the first value to simply be displayed in the scan results report, but ignores it for scan decision purposes.
- Is defined Requires that the first value is defined. There are many reasons why a value may not be defined. For example, the BullScript Close/(High-Low) will be undefined if the high and low both have the same value. (Otherwise an undefined value will appear as N/A in the results window).
- Turned up Matches securities where the value had previously fallen, but has now increased in value. That is, a local trough has formed. Many indicators are interpreted by examining where they turn. (Note: If the value used is not smooth then this will trigger frequently). Not to be confused with “has increased”. A security that has traded at $1, $2, $3 has increased, but not turned up. However, security that has traded at $2, $1, $3 has both increased and turned up.
- Turned down Similar to turned up, but matches securities where the value had previously increased, but has now fallen. That is, the value has formed a local peak.
Any/Every Bar In the Last [ ] Days
You can perform the comparison over a number of days, weeks, quarters, years depending on what period is selected. If the number of bars is set to 1 then the any/every day drop down is ignored. The term ‘bars’ is used so as to be independent of the period.
Any The condition must be met at least once in the specified number of days. For example: Close crossed above Moving Average any day in the last 10 days.
Every The condition must be met every day for a specified number of days. For example: Close was greater than Open every day in the last 5 days. Note that this should not be used with some comparison types. For example “The close crosses above the moving average every day in the last 5 days” will never trigger as two consecutive cross ups can never occur.
Scan Criteria Description
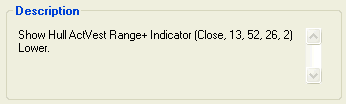
The Description panel automatically shows a plain-English description of your criterion. Check the description to ensure that the values you have entered will have the desired effect. Note: If the criterion is complicated, you may need to scroll down to see the whole description.
Indicators are shown by first showing their name, followed by each of their settings in brackets. Where multiple plots are available, the plot selected is also shown in the description. For example: Close crosses above Bollinger Bands (Close, Simple, 14, 2, 0) Bottom.
Other Value Types
Apart from pricing information such as Last price, Open , High, Low, Close, BullScan allows you to scan on a wide range of types of values including, Number, Indicators, Indicator Signals, Fundamental data and customised values using BullScript.
Using Numbers
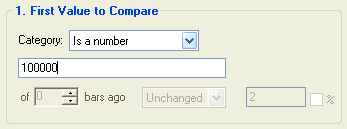
Is a number is for you to enter your own specific number. For example, you would use number to find all securities with a volume greater than 100000.
Using Indicators
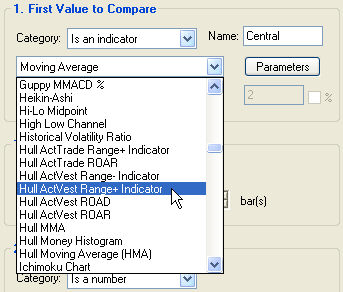
To compare against an indicator, first select Is an indicatorfrom the value type drop-down. The second row will change to show the indicator drop down. By default the Moving Average will be selected. You can select another indictor.
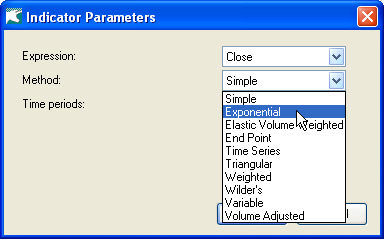
Many indicators have various settings, such as the length of a moving average. Other indicators, such as Bollinger Bands, return multiple values. In each of these cases, the Parameters button will be enabled. Press it to access the window shown above. Then you can select various scan settings, and the output to use (where applicable).
To check for a signal, such as a candle pattern, select “Is an indicator signal” from the value type drop-down. Use the parameters button to set options. If an indicator has more than one signal (they often come in pairs) then the first drop-down on the parameters window allows you to select which signal is being scanned. A value type of “Is an indicator signal” will typically be used with a comparison type of “Is True”.
Using Indicators Signals
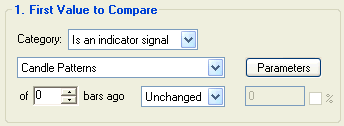
Some indicators display signals or markers. It is possible to use these as scan criteria. Select “Is an indicator signal” in the first drop down. The second drop down will then display all indicators that have markers in them. Press the parameters button to adjust any settings for that indicator. The parameters button also lets you select which specific marker you want to use.
You can also scan for candle patterns in this manner. Select “Is an indicator signal”. Then select the “Candle Pattern” indicator. Finally, press the parameters button and select the required candle pattern from the drop-down.
The indicator signal value type will typically have a condition of “Is true” or “Is false”, and a second value will not be required.
Using Fundamentals
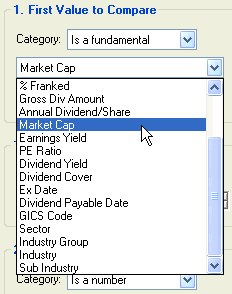
Is a fundamental give you the ability to filter further on a range of different criteria. For example, traders may only wish to search stocks that have a certain Market Capitalisation or P/E ratio.
Available Fundamental Fields
Total Class Issue is the number of shares that have been issued.
Net Tangible Assets is the Net Tangible Assets of the company as released to the ASX.
Earnings Rate Per Share is the company’s earnings for the past 12 months, divided by the number of shares. Company earnings are reported every 6 months, and Earnings Rate Per Share is adjusted for any dilutions that have occurred since either of the earnings reports.
Dividend Rate Per Share is the amount of dividend that has been paid for each share over the past 12 months, as reported by the company. Dividends are reported every three or six months, and any dilutions are taken into account. This does not include any special cash or scrip dividend.
Current Dividend Amount is the cash dividend amount of the most recently announced dividend, net of withholding tax.
Franked Percent is the portion of the dividend on which taxation has already been paid.
Gross Dividend Amount is the amount payable per security, taking into account company tax and franking for both interim and final dividends.
Annual Dividend Rate Per Share is the amount of dividend that has been paid for each share over the past 12 months, as reported by the company. Dividends are reported every three or six months, and any dilutions are taken into account. Unlike the Dividend Rate Per Share, this does include any special cash or scrip dividend.
Market Capitalisation represents the total worth of a company, and is calculated as the current price per share multiplied by the Total Class Issue.
Earnings Yield The earnings per share for the last 12 months divided by last price in cents. It is the inverse of the Price/Earnings Ratio.
Price/Earnings Ratio is the current price per share divided by the Earnings Rate Per Share.
Dividend Yield is the Dividend Rate Per Share divided by the price per share, expressed as a percentage.
Dividend Cover This ratio shows the proportion by which the dividend is covered by the earnings. A dividend cover greater than 1.3 times is considered comfortable. If the dividend cover is less than 1, then the company is paying out more than it is earning.
Ex Date is the date from which a security holder will retain their rights to benefits associated with owning the security, such as dividends. Can not currently be used in comparisons. Use “show this value”, or use for sorting.
Dividend Payable Dateis the date on which the most recently announced dividend becomes/became payable. Can not currently be used in comparisons. Use “show this value”, or use for sorting.
GICS Code The eight digit Global Industry Classification System code. It represents four groups of two digits that signify the sector, industry group, industry and sub industry respectively.
Sector The name of the GICS sector.
Industry Group The name of the GICS industry group.
Industry The name of the GICS industry. Note: this is withheld by the ASX for some securities.
Sub Industry The name of the GICS sub industry. Note: this is withheld by the ASX for many securities.
Using BullScript
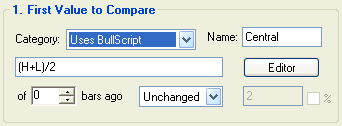
Uses BullScript gives you a convenient way to further customize the search criteria for advanced users. You can enter your own formula such as (High + Low)/3 to further refine the scan. Please refer to the Getting Started with BullScript guide available from the main Help menu. Only expressions are allowed. You may not define variables. (Internally the entire scan uses BullScript, and your script is copied into the scan’s script).
You can also press the Editor button to bring up a larger script-editing window, which also includes the script helper tools. See the BullCharts guide for information about how to use the Script Editor.
Selecting Securities to Scan On
BullScan performs the scan over one or more groups of securities. There are several different types of groups, such as WatchLists, securities in an index, securities in an industry sector, and others. By default, scans will scan on a group called “Default”. If you are using BullSystems as your data source, the default group will scan over all Ordinaries shares. If you are using MetaStock as your data source, the default group will scan all securities in the folder.
There are two ways that you can customize what securities get scanned. First you can modify what the default group is. This will apply to every scan that uses the default group. Or second, you can modify the groups that an individual scan will run on.
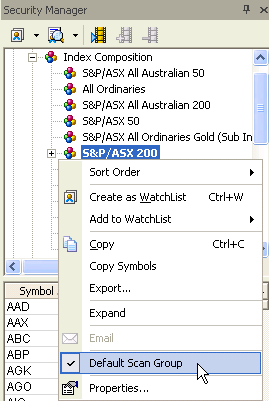
Modifying the Default Group
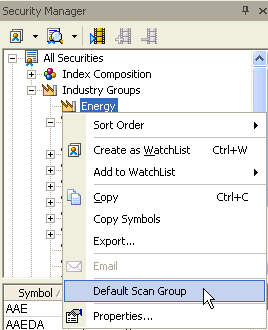
To set the default group, that is the group of securities that scans will scan on by default, first open the security manager by selecting Security Manager from the tools menu. Right click on the group that you would like to make the default group, and click “Default Scan Group”.
In the example below, the S&P/ASX200 has been made the default group. This means that any scans that any scans which aren’t using a customised list of groups will scan on securities in the S&P/ASX200 index.
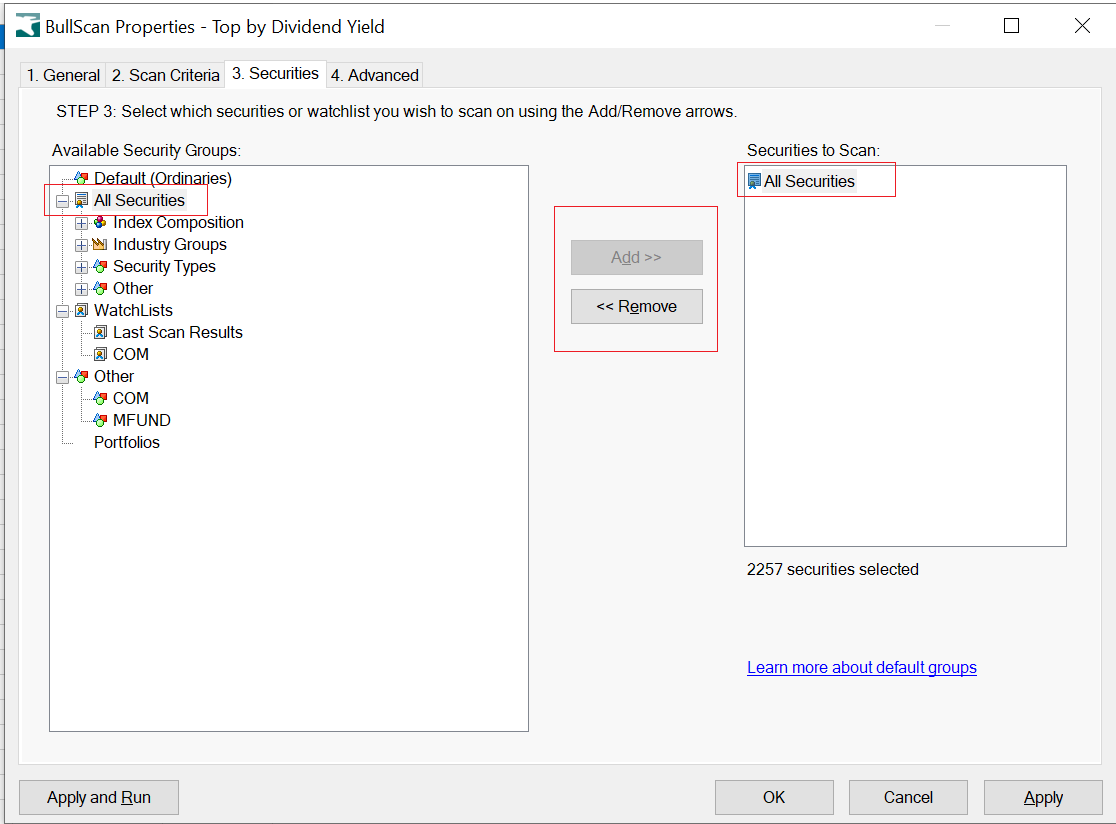
Modifying the Securities for a Specific Scan
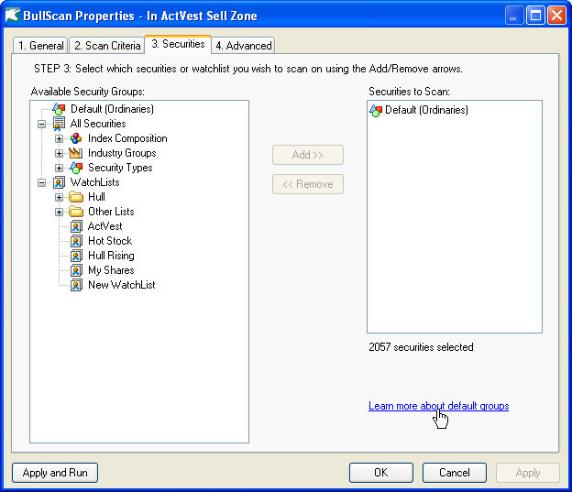
The securities to be scanned can be modified of a per-scan basis. By default each scan will scan on the default group, as described above. To modify a specific scan, select the securities tab in the scan properties. Select a group of the left and press Add to add it. Select a group on the right and press Remove to remove it.
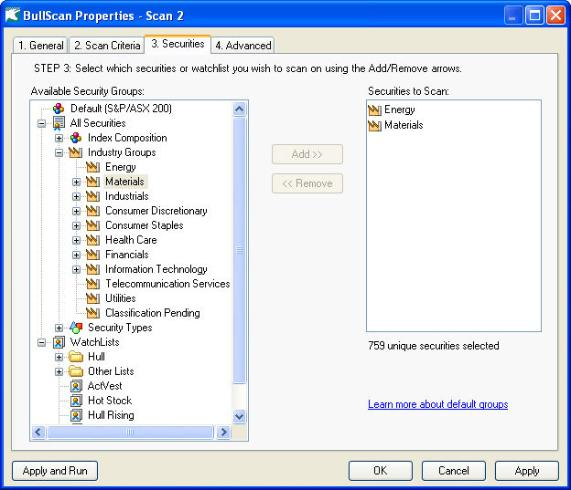
Scan on Industry Groups in BullScan
To restrict your scan to a specific industry group, select the Default group on the right and click remove. Then find the industry group you wish to scan, e.g. Energy, on the left and click Add. This can be done with multiple groups, or sub groups.
Select which Security Groups you wish, then select Add>> or <<Remove.
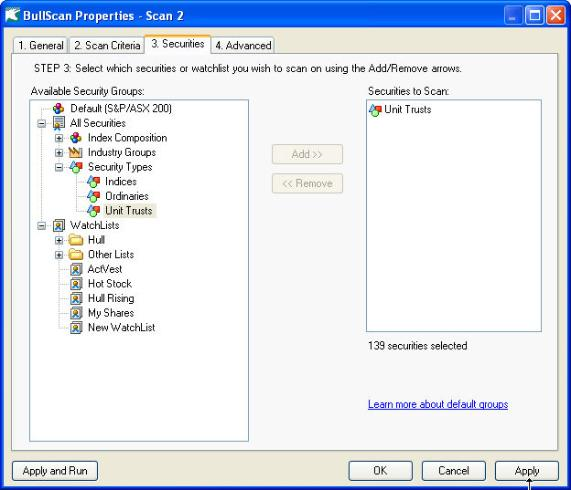
Scan on Security Types in BullScan
BullScan also allows you to select a group of securities types. BullScan database currently scans on data that includes Ordinary Equities, Indices or Unit trusts. Warrants and Options are not included in the scan database. The default type is all Ordinary equities.
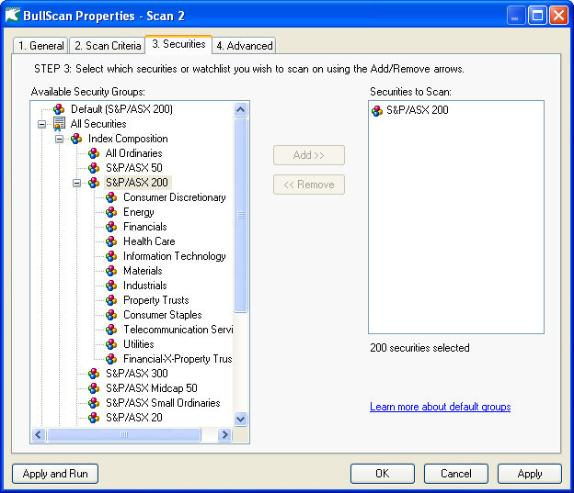
Scan on Index Compositions in BullScan
You are able to restrict you scans to only securities that are participating in an index, such as the S&P/ASX200. Remove any existing groups then add the index you wish to scan on. Note: The industry indices can be found underneath the S&P/ASX200 index.
If you wish to scan on the indices themselves, and not the securities within them, then refer to the previous section on scanning on a security type.
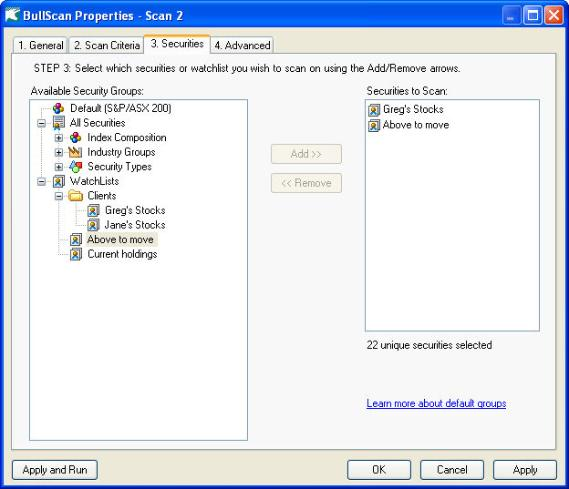
Scan on your own WatchList in BullScan
Scan Results
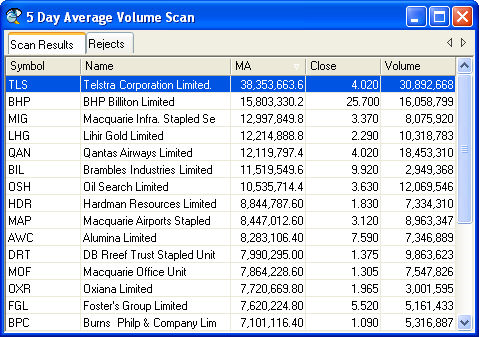
When you run a scan, the securities in the database will be checked against your scan criteria. Each security that matches at least one criterion will be shown in the results grid. If “match all criteria” is not switched on then a score is calculated for each security based on the number of criteria matched, and the relative importance of those criteria. A security that matches all criteria will have a score of 100.
Columns for the scan report will be automatically picked based on the criteria that are used in the scan. By default the results will be sorted by the column set in the scan advanced properties. You can sort the results by a different column by clicking on that column’s heading. Clicking a second time will sort in the reverse order. Notice the white triangle in the column heading. This indicates what sorting is in effect.
BullScan Results Toolbar
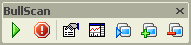
 Start Scan Press this button to run or rerun the scan that is currently open.
 Stop Scan Press this to cancel the scan. It will also clear the results.
 Properties Use this to access the scan criteria and other scan properties for the current scan.
 Create Linked Chart Creates a new chart containing any indicators used on the scan. The windows are positioned so both can be easily seen. Clicking on a scan row will update the chart to see that security.
 Start/Stop Slide Show Creates a linked chart, if one not already created. The cursor then automatically moves down the scan results list, showing each chart in turn. Be careful not to confuse this with the workspace slide show. Note: The spacebar key may also be used to start/stop the slide show.
 Flip Faster Increase the speed of the scan slide show.
 Flip Slower Decrease the speed of the scan slide show.
If you click on a scan row, or link a scan to a chart, then one row on the scan results gets highlighted blue. This is the current row.
The following keyboard shortcuts can be used to change the current row:
- Up Arrow – View previous security
- Down Arrow – View next security
- Page Up – Scroll up one page
- Page Down – Scroll down one page
- Home – Move to the top row
- End – Move to the last row
These are particularly helpful if you have a scan linked to a chart, as you can quickly see a chart for each security in the scan.
Last Scan Results
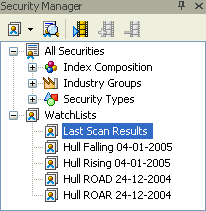
Last Scan Results watchlist in Security Manager
After a scan is performed, the results of the scan are automatically stored in a watchlist called Last Scan Results. This makes it easier to recall the results of the last scan for later review.
MultiScan
BullScan allows you to select multiple scans to process. There are two options. The first default option is to reuse the results from the last scan. This allows the combination of different scans to produce the final results list. The second option is to create a list of separate scans that can be run one after another for convenience. When one scan is finished the next scan will commence automatically. Individual result windows will be created per scan.
To use this feature, use the Shift or Ctrl key to select multiple scans then select Run . A dialogue box will appear that allows you to change the order that the scans will be processed.
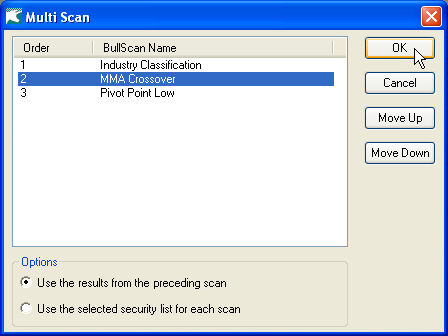
Use the results from the preceding scan will save the results from the previous scan to use in the next scan. Only one final result will be presented.
Use the selected security list for each scan will create separate windows for each scan that has been selected.
 will adjust the order of how the scans will be executed. When using the option Use the results from the preceding scan, changing the order of the scans will change the final results.
Linking Scans To Charts
Creating Linked Charts
After you have run a scan, you can create a linked chart to quickly see a chart of each security found in the scan. There are several ways to create a linked scan:
- Select New Linked Chart from the View menu or scan context menu
- Press the Linked Chart icon
 on the toolbar
 - Start a scan slide show
- Double click on a row in the scan results
By default, when a new linked chart is created, any indicators that are used in the scan are automatically added. It also uses the same period as the scan. You can add additional indicators to the chart if you like. These behaviours can be adjusted in the Scan tab of the BullCharts Preferences window.
Once a scan is linked to a chart, clicking once on any row in the scan will cause the chart to be updated to show that security.
Linking to an Existing Chart Window
You can link your scan to an existing chart that you have already set up. Right click on the scan and select “Select Linked Chart”. A window will appear, showing you all of the charts currently in your workspace. Select the chart that the scan should be linked to. Clicking on a scan row will then update the security of that chart.
Unlinking a Chart
To unlink a chart so that it no longer received updates from the scan, right click on the scan and select “Clear Linked Chart”.
Updates to Scans
When you create a new linked chart, any indicators that are used in the scan are automatically added to the chart. If you then change the properties of the scan (for example, adding a new indicator, or changing the indicator parameters) then BullCharts will prompt you asking if you want to update the linked chart with the new parameters or not.
If you press yes, then any items on your linked chart will be cleared and recreated based on what’s in your scan. Note: If you have added any new items to the linked chart then they will also be lost.
If you press no, then the chart will remain unchanged.
Merging Scans
To find all securities that match two scans, create a new scan. Then copy and paste all of the criteria from both of the original scans into the new scan.
Note: This method will only work if both scans use “Match All Criteria”, if they both have the same period, and if neither of them filter to a certain number of rows. Future versions of BullScan will allow scan results to be directly reused in different scans.
Scanning for Candlestick Patterns
To create a criteria that searches for a certain candlestick pattern:
- Create a new criteria
- Underneath the words “First value” select “Is an indicator signal”
- In the next drop down, select “Candle Patterns”
- Press the Parameters button
- Select the candle pattern you would like to search for
The condition will be automatically changed to “Is True”. If required, you can change this to “Is False”. Other options such as “of n bars ago” and “any time in the last n bars” will work as per normal.
Scans don’t need to be manually saved and loaded. However, each scan is internally stored in its own file. Built in scans are located in the DefaultScans folder, and scans that you create or modify are stored in the CustomScans folder. These are typically at:
C:\Program Files\BullSystems\BullCharts\DefaultScans
C:\Program Files\BullSystems\BullCharts\CustomScans
It is possible to rename custom scans directly using Windows Explorer, however it is recommended that you do not do this while BullCharts is running.
Emailing a Scan to Another Person
To send a scan to someone else:
- Start BullCharts and open the scan manager
- Right click on the scan you wish to email
- Select “Email”
- Your default mail program will start and the scan will be attached to a new message.
- Enter the recipients email address, and add any other text to the message.
- Press the Send button
Note: As of version 2.3.2, the file format for BullScan has been modified to use XML, which allows more flexibility. Newer versions can read older scan files, but older versions can not read the new file format. If you are emailing a scan to a friend, ensure they have version 2.3.2 or newer.
Receiving a Scan from Another Person
- Check in BullCharts to see if you already have a scan with the same name. If so, rename it (or it will be replaced)
- Open your mail program and find the email message
- Right click on the attachment and select Save As
- Save it into the your CustomScans folder (see above)
- Restart BullCharts
Alternatively, if BullCharts is running and depending on the email program you are using, you can drag the scan attachment out of the email program and drop it onto BullCharts, which will automatically copy it into the CustomScans directory.
Backing Up/Restoring Scans
You can safely back up and restore scan files from the CustomScans folder using the same method that you use to back up other documents. For example, on CD-ROM.
Undeleting Built In Scans
It is possible to delete the built in scans in BullScan. If you have deleted, or renamed, any built in scans then the original scan file remains in the DefaultScans folder, but a file called hiddenscans.txt is created to record that you have deleted the scan. Delete the hiddenscans.txt file and restart BullCharts to recover any deleted built-in scans.
Troubleshooting
You scan for condition xyz and a security was found, but the chart for that security did not seem to show condition
Possible causes:
- Make sure that the scan is set to the same period as the chart.
- Ensure that your database is up to date. A scan will only use the data in the database, whereas a chart can collect new data from the server.
- Remember: Scans do not use live data, so if your chart has live-subscription turned on then it is displaying one data point more than was in the scan.
- If Match All Criteria was not turned on, and a particular criteria was not set as Required then the security may not need to match that criteria to appear in the scan results.
- If period is weekly, monthly, quarterly or yearly then the last data point on the chart may be an incomplete period, which is not included in the scan by default. If it’s the last day in the period, then ensure that you have downloaded the data for that day.
- Remember that criteria work independently. This can have unexpected results when “any/every time in the last n bars” is used. For example: If one criteria is “Crossover any time in the last 5 bar” and another criteria is “Between, any time in the last 5 bar” then these two events don’t necessarily need to happen on the same bar.
- Don’t use the percent checkbox when specifying a modification on price change %. For example: “Price plus 5%” is correct. “Price % change plus 5” is correct. But “Price % change plus 5%” is not correct.
- The BullCharts forum (http://www.bullcharts.com.au/forum) is a good place to look for more tips and solutions to common problems.